
Figure 3.
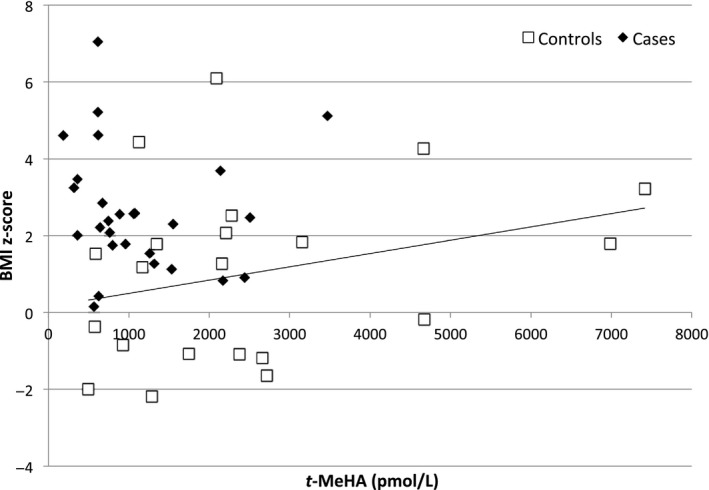
Tele‐methyl‐histamine (t‐MeHA) levels according to BMI z‐score in case and control children. BMI z‐score: body mass index z‐score, t‐MeHA levels: cerebrospinal fluid tele‐methyl‐histamine (t‐MeHA) levels; cases: narcoleptic children (cases) are represented by black diamond‐shaped figure (♦), control children by empty squares (□). A significant increase in CSF t‐MeHA was observed with the increase in BMI z‐score among controls (P = 0.006), while no association was observed among cases (P = 0.15) (multivariable regression model M1)