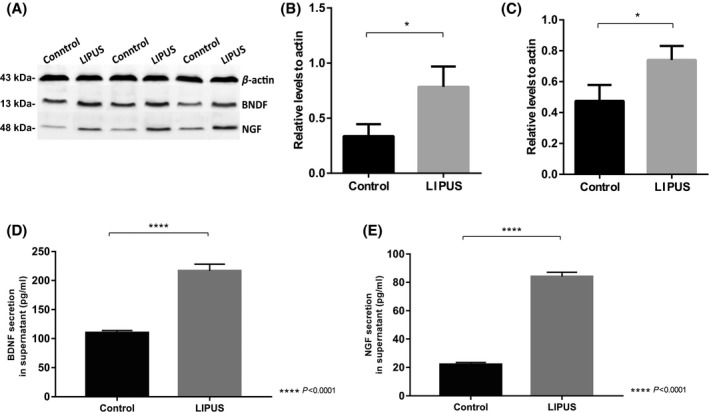
Figure 3.

A‐C, Western blotting results show expression of BDNF (B) and NGF (C) in control group and LIPUS stimulation group. Graphs indicate relative band intensities compared with that of β‐actin (A) (n = 3 for each group). The intensity of BDNF (B) and NGF (C) bands in the LIPUS group was significantly higher than those in control group. *P < 0.05, compared to β‐actin. D‐E, Expression of BDNF and NGF in supernatant by ELISA analysis. (D) BDNF secretion in supernatant of LIPUS group was significantly higher than that in control group (P < 0.0001). (E) NGF secretion in supernatant of LIPUS group was significantly higher than that in control group (P < 0.0001)
