Figure 4.

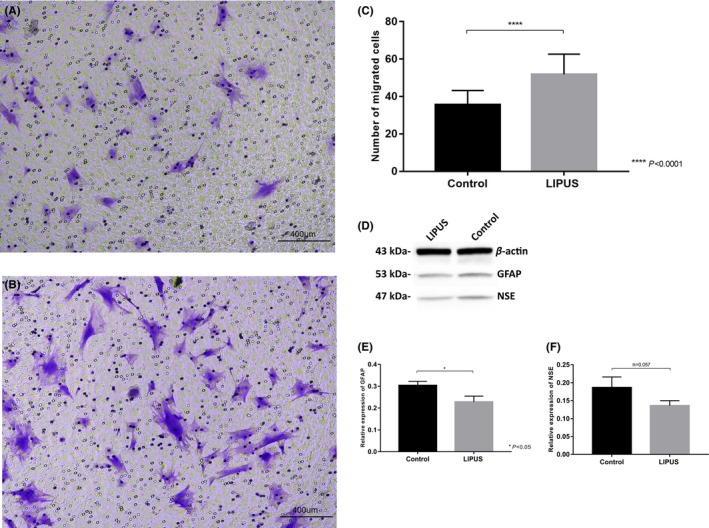
A‐C, Determination of BMSCs migration with the transwell assay. Migration of BMSCs was assessed with transwell assays. Representative images of migrated cells in control group (A) and LIPUS stimulation group (B) stained with crystal violet are shown (scale bar = 400 μm). The number of migrated cells was counted(C). Data are shown as the mean ±SD *P < 0.05, **P < 0.01. D‐F, The expression of NSE and GFAP is determined by Western blot (D), GFAP expression was decreased after LIPUS stimulation (P < 0.05) (E), while the difference of NSE expression between two groups was not significant (P > 0.05) (F)
