
Figure 5.
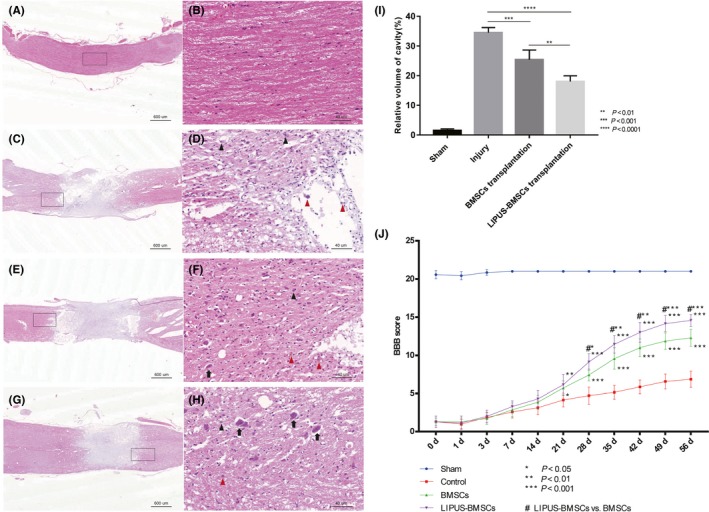
A‐H, Representative photomicrographs of Hematoxylin and eosin staining of spinal cord tissues in Sham group (A, B), Injury group (C, D), BMSCs transplantation group (E,F), LIPUS‐BMSCs transplantation group (G,H), the black boxes in A, C, E, G (scale bar = 600 μm) magnified in B, D, F, H (scale bar = 40 μm). Motor neurons (black arrows) were clearly observed in LIPUS‐BMSCs transplantation group (H); neutrophils (black arrow head) and macrophages (red arrow head) infiltration were observed in Injury group and BMSCs group (D & F). I, Size of lesion cavity is measured from sagittal images of A, C, E, G, and the relative volume of cavity is compared with each other, cavity volume of LIPUS‐BMSCs transplantation group was significantly smaller than BMSCs transplantation group (P < 0.001) and Injury group (P < 0.0001). J, The Basso, Beattie, and Bresnahan (BBB) open‐field locomotor test. Data are reported as mean ± SD in each group. BBB scores range from 0 (complete paralysis) to 21 (normal gait). The results demonstrated that rats in the LIPUS‐BMSCs transplantation group have the best hindlimb functional recovery among all the groups. From the time point of 49 days, the curve in the four groups gradually plateaued. BBB locomotor functional score is given as the mean for all four groups and error bars represent the SD. Analysis was performed using two‐way ANOVA with Bonferroni posttests, *P < 0.05, **P < 0.01, ***P < 0.001 compared with Injury group. #*P < 0.05, #**P < 0.01,#***P < 0.001, compared with BMSCs transplantation group