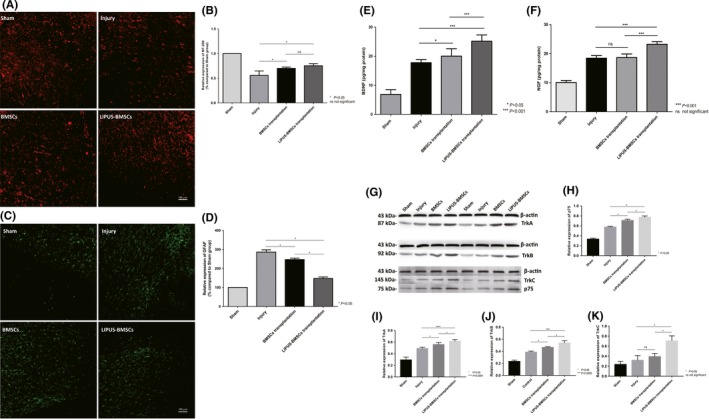
Figure 6.

A‐D, Transplantation of BMSCs and LIPUS‐BMSCs harnesses axon regeneration and reduces reactive gliosis. A, Immunofluorescence demonstrated NF‐200 staining in red channel from Sham group, Injury group, BMSCs group, and LIPUS‐BMSCs group on day 56 after SCI, respectively. B, Semiquantification of NF‐200 expression area according to immunostaining (A), expression level was expressed as percentage compared with Sham group (set as 100%). C, Immunofluorescence demonstrated GFAP staining in green channel from Sham group, Injury group, BMSCs group, and LIPUS‐BMSCs group on day 56 after SCI, respectively. D, Semiquantification of GFAP expression area according to immunostaining (C), expression level was expressed as percentage compared with Sham group (set as 100%). *P < 0.05 compared with Injury group, P < 0.05 compared with LIPUS‐BMSCs group. One‐way ANOVA followed by Tukey's post hoc test. ns indicates no significant difference. E‐F, ELISA evaluation of BDNF (E) and NGF (F) expression level in Sham group, Injury group, BMSCs transplantation group, and LIPUS‐BMSCs transplantation group. *** shows significant difference with BMSCs transplantation group and Injury group in P < 0.001 level; ns shows no significant difference was observed compared with Injury group. G‐K, Western blot analysis of neurotrophic factors receptors. Western blotting was performed to examine expression of TrkA, TrkB, TrkC, and p75 proteins. To detect the phosphorylated form of the neurotrophic factors, the corresponding blot was stripped and subsequently stained with an antibody to phosphorylated protein. The notation to the left of each blot indicates the running position of molecular weight standard proteins on the same gel (G). Relative expression of p75 (H), relative expression of TrkA (I), relative expression of TrkB (J), and relative expression of TrkC (K)
