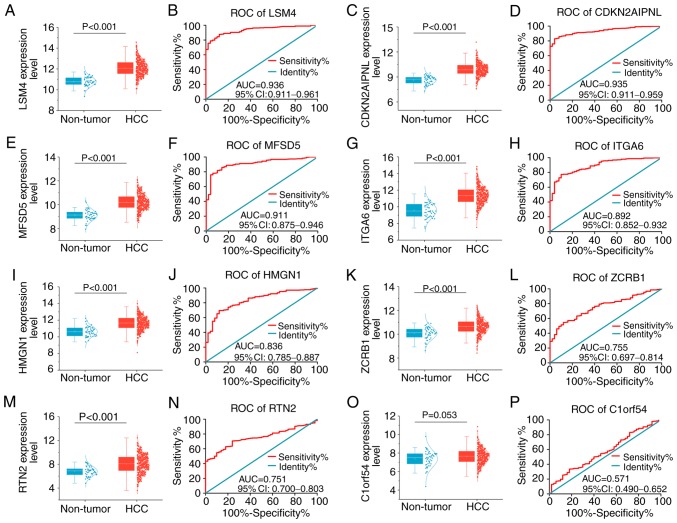
Figure 5.
Expression levels and receiver operating characteristic curves of eight key genes between liver cancer and non-tumor samples. Gene expression was assessed in liver cancer and non-tumor samples. (A) Scatter plot and (B) ROC curve of LSM4 expression. (C) Scatter plot and (D) ROC curve of CDKN2AIPNL expression. (E) Scatter plot and (F) ROC curve of MFSD5 expression. (G) Scatter plot and (H) ROC curve of ITGA6 expression. (I) Scatter plot and (J) ROC curve of HMGN1 expression. (K) Scatter plot and (L) ROC curve of ZCRB1 expression. (M) Scatter plot and (N) ROC curve of RTN2 expression. (O) Scatter plot and (P) ROC curve of C1ORF54 expression. ROC, receiver operating characteristic; HCC, hepatocellular carcinoma; AUC, area under the ROC curves; CI, confidence interval; LSM4, U6 snRNA-associated Sm-like protein LSm4; MFSD5, molybdate-anion transporter; HMGN1, non-histone chromosomal protein HMG-14; RTN2, reticulon-2; CDKN2AIPNL, CDKN2AIP N-terminal-like protein; ITGA6, integrin α-6; ZCRB1, zinc finger CCHC-type and RNA-binding motif-containing protein 1; C1orf54, uncharacterized protein C1orf54.

