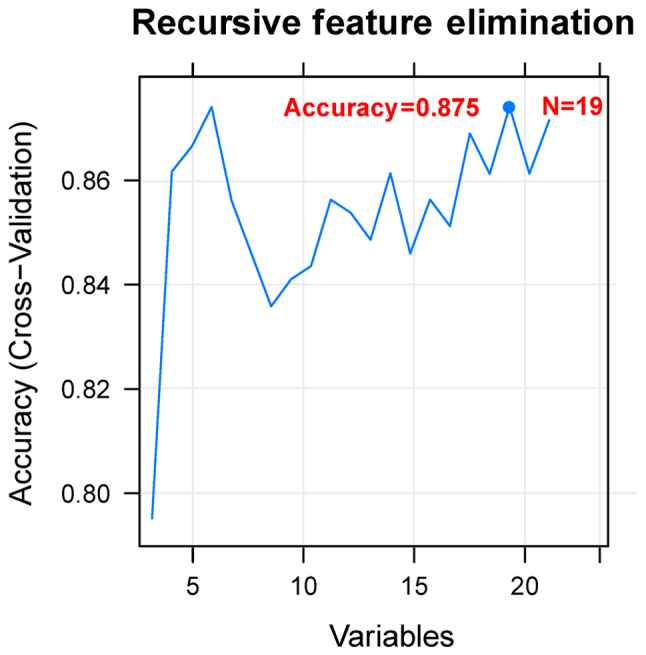
Figure 3.

Accuracy curve for screening the optimal miRNA set. The horizontal axis represents the number of miRNA variables, and the vertical axis represents the cross-validation accuracy. The marked content is the number of miRNAs corresponding to the optimal miRNA set.
