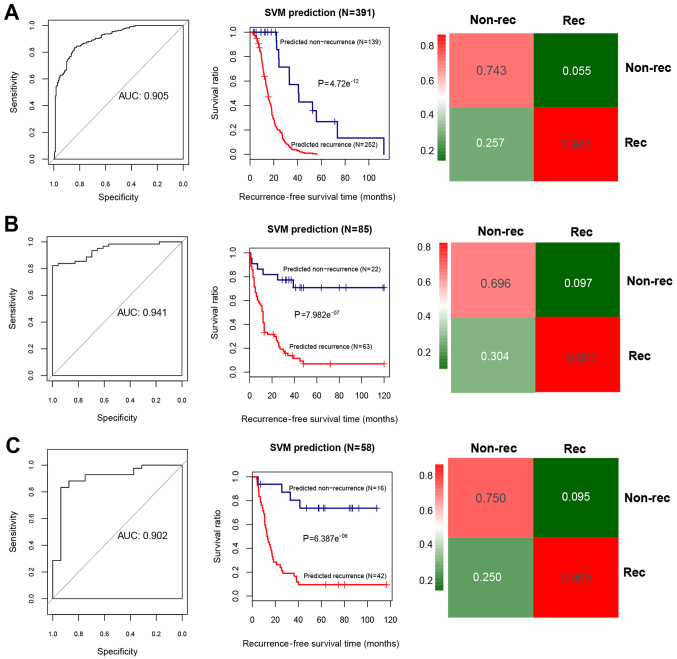
Figure 4.
Area under the receiver operating characteristic (AUC) curves, the Kaplan-Meier (KM) survival curves, and the confusion table diagrams based on the Support Vector Machine (SVM) classifier. (A) The AUC curve (left), KM curve (middle) and confusion table diagram (right) for the training dataset. (B) The AUC curve (left), KM curve (middle) and confusion table diagram (right) for the validation set 1 (GSE25204). (C) The AUC curve (left), KM curve (middle) and confusion table diagram (right) for the validation set 2 (GSE27290). In the KM curves, blue and red curves separately represent the non-recurrent and recurrent tumor samples determined by the SVM classifier.

