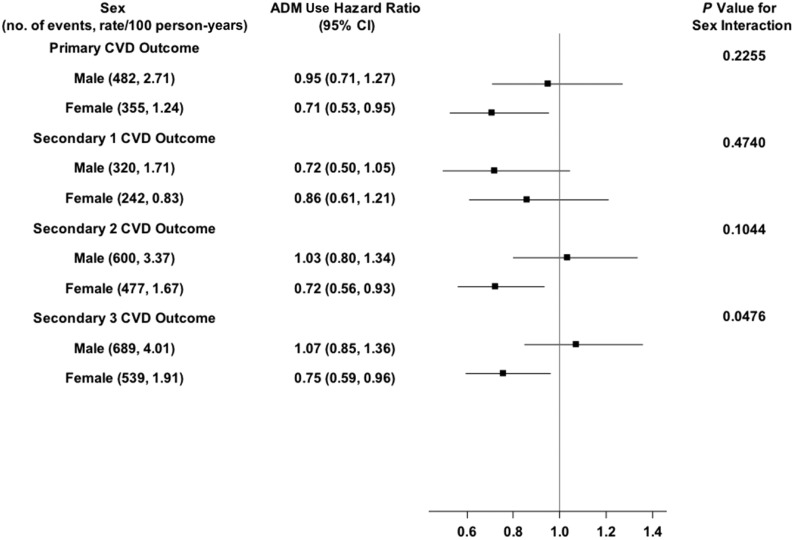
Figure 3.
Shown are the number of CVD events and the rate per 100 person-years, the HRs (95% CIs) for ADM use (ADM) for the primary and secondary CVD outcomes in men and women, and the P value for the sex × ADM use interaction effect. The solid vertical line indicates an HR of 1.00 (i.e., no effect).

