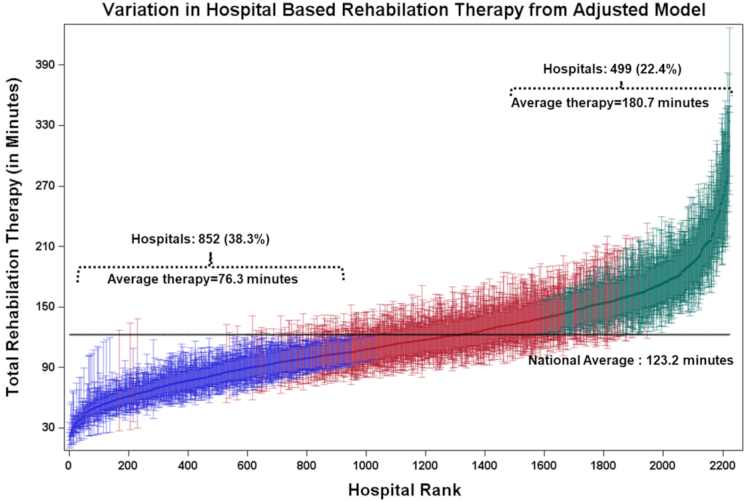
Figure 2.

Hospital-level variation in total rehabilitation therapy minutes after adjusting for patients and hospital characteristics. Hospital rank for total rehabilitation amount given (in minutes) estimated by multilevel, multivariable random effect models adjusted for patient- and hospital-level characteristics. Horizontal lines present the unadjusted mean [SD] of total rehabilitation therapy minutes given (123.2 [99.0]). Each vertical line represents the adjusted mean with 95% confidence interval for each of the 2200 hospitals. Blue lines reflect the 852 (38.3%) hospitals where total rehabilitation therapy minutes provided (76.3 [19.2]) were lower than average rates. Green lines indicate the 499 (22.4%) hospitals where total rehabilitation therapy minutes (180.7 [36.1]) provided were above the average rates. Red lines reflect the 849 (38.5%) hospitals where total rehabilitation therapy minutes provided fell within a national average range.
