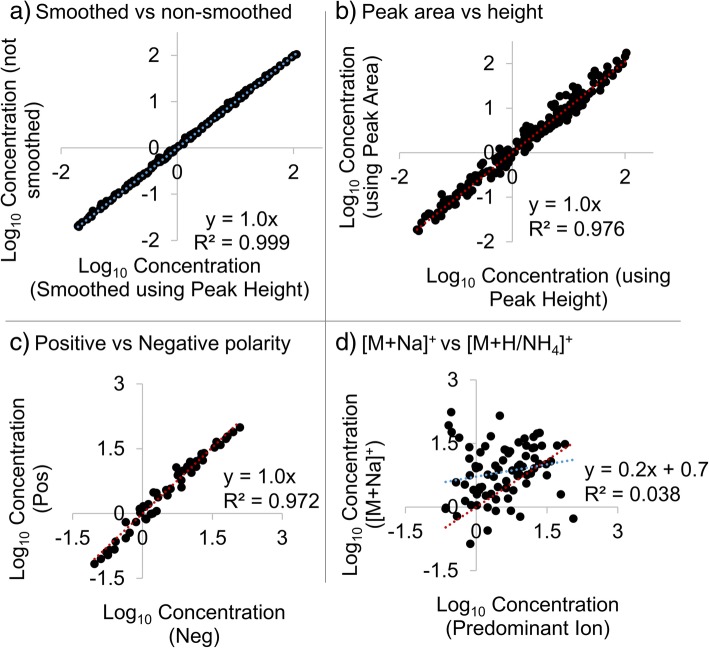
Fig. 3.
Linear regression comparing the log10 of normalized lipid levels calculated using different workflows and ions. A slope of 1 and R2 close to 1 are expected if the methods or ions both result in similar normalized lipid levels. The panels show normalized levels calculated using smoothed versus non-smoothed peak heights (smoothing was done as the final step in MZmine; n = 184; a), peak area versus peak height (n = 184; b), positive versus negative polarity using peak area (n = 51; c), and sodium adducts versus the major adduct observed in positive polarity using peak area (n = 76; d). For d, sodium adducts were compared to protonated adducts except in the case of neutral lipids which formed ammoniated adducts

