
Fig. 5.
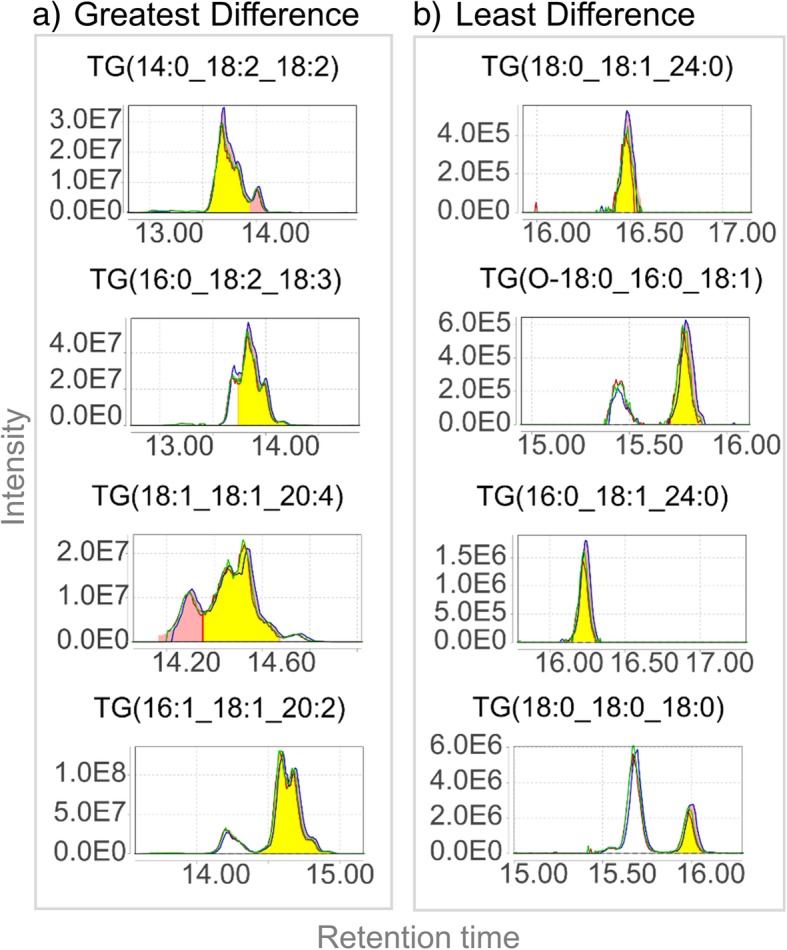
Extracted ion chromatograms (EICs) and peak integration by MZmine of the triglycerides (TGs) with the most (a) and least (b) percent difference when comparing quantitation using peak height versus peak area
Official websites use .gov
A
.gov website belongs to an official
government organization in the United States.
Secure .gov websites use HTTPS
A lock (
) or https:// means you've safely
connected to the .gov website. Share sensitive
information only on official, secure websites.
Extracted ion chromatograms (EICs) and peak integration by MZmine of the triglycerides (TGs) with the most (a) and least (b) percent difference when comparing quantitation using peak height versus peak area