
Fig. 1.
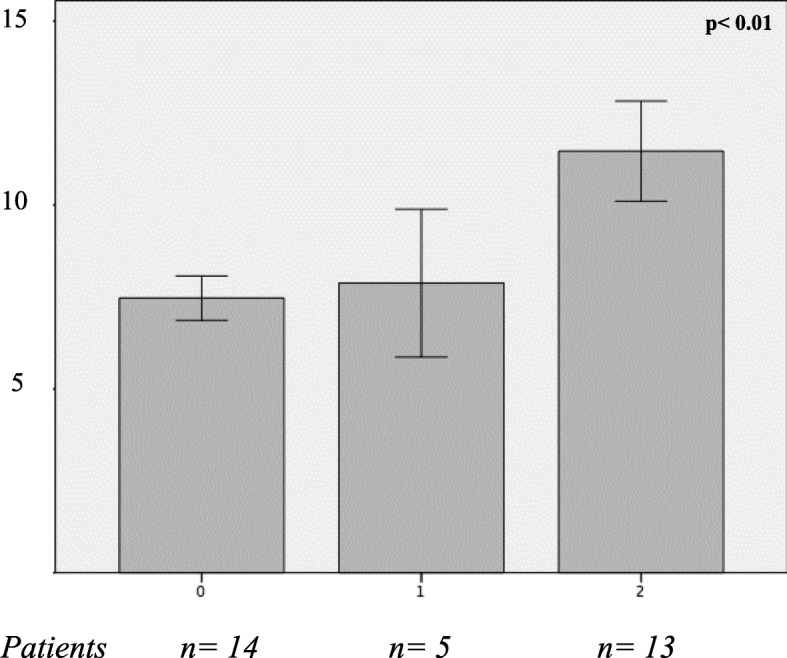
Plasma copeptin (pmol/L) in relation to the presence and severity of NASH (0 = absent; 1 = borderline; 2 = NASH). ANOVA test applied
Official websites use .gov
A
.gov website belongs to an official
government organization in the United States.
Secure .gov websites use HTTPS
A lock (
) or https:// means you've safely
connected to the .gov website. Share sensitive
information only on official, secure websites.
Plasma copeptin (pmol/L) in relation to the presence and severity of NASH (0 = absent; 1 = borderline; 2 = NASH). ANOVA test applied