Fig. 2.
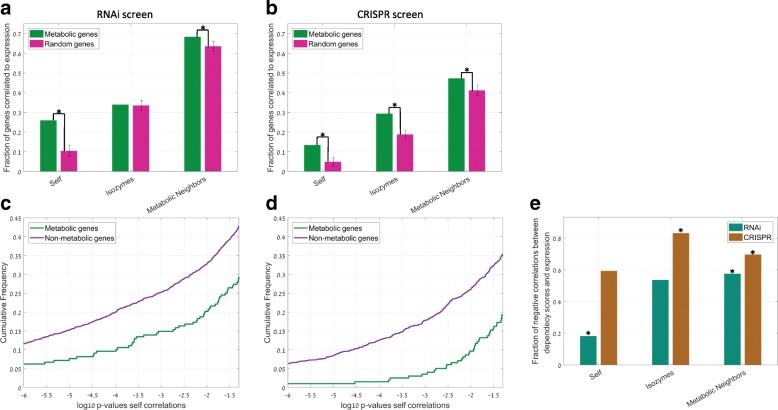
Cell line-specific dependence on metabolic enzymes is explainable by the expression level of neighboring enzymes in the metabolic network. a, b The fraction of metabolic genes whose cell line-specific RNAi (a) and CRISPR (b) gene dependency scores are significantly correlated with their expression, with the expression of an isozyme and with the expression of a neighboring enzyme in the metabolic network (shown in green) versus the fraction of metabolic genes with such significant correlations when randomly shuffling the expression measurements across genes (in pink). c, d The correlation between gene expression level and RNAi (c)- and CRISPR (d)-based dependency scores of metabolic (green) versus non-metabolic (purple) genes; showing the cumulative distribution of FDR-corrected Spearman p values. e The fraction of negative Spearman correlations (out of all significant correlations; positive or negative) between RNAi (green)- and CRISPR (brown)-based gene dependency scores and the expression level of the gene, that of an isozyme, or a neighboring enzyme. The asterisk marks a statistically significant high number of positive correlations (binomial p value < 0.05)

