Fig. 3.
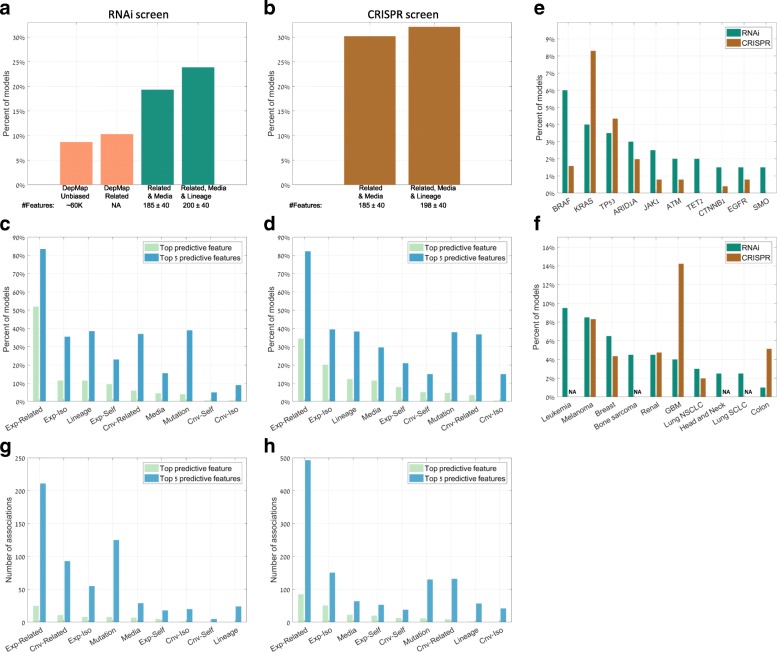
Predictive models for cell line-specific dependence on metabolic genes combining multiple molecular features. a, b The fraction of metabolic genes for which a significant predictive model of RNAi (a)- and CRISPR (b)-based gene dependency was generated by focusing on molecular features of neighboring enzymes and culture media and when also considering cancer lineage information (green for RNAi, brown for CRISPR). In comparison, the number of generated predictive models for RNAi-based gene dependency scores of metabolic genes derived by the Dependency Map project (based on molecular featured of all genes and using related genes) is shown in orange. c, d The prevalence of various types of features as the top (green) or within the top 5 (blue) features in the generated predictive models of RNAi (c)- and CRISPR (d)-based dependency scores of metabolic genes. “Exp” and “Cnv” are used as the abbreviations for gene expression and copy number variation, respectively. “Iso” and “Related” are used as abbreviations for an association of the target gene with its isozyme and related gene (i.e., neighboring enzyme), respectively. e, f The prevalence of specific oncogenic mutations (e) and cancer lineages (f) within the top 5 features in the generated predictive models for RNAi (green)- and CRISPR (brown)-based metabolic gene dependency scores. g, h The number of the top (green) or within the top 5 (blue) features in the generated predictive models that are not individually correlated with the RNAi (g)- and CRISPR (h)-based dependency scores

