
Fig. 2.
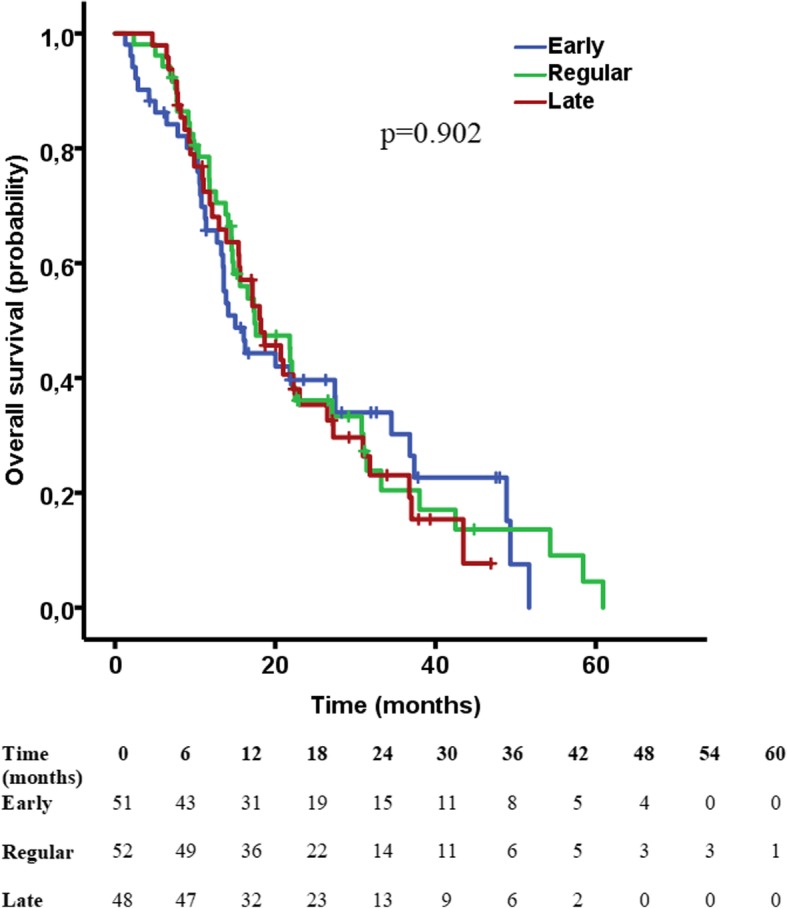
Kaplan-Meier curve for OS between the three groups, showing no difference in OS between the groups (p = 0.902). Hash marks indicate censored cases
Official websites use .gov
A
.gov website belongs to an official
government organization in the United States.
Secure .gov websites use HTTPS
A lock (
) or https:// means you've safely
connected to the .gov website. Share sensitive
information only on official, secure websites.
Kaplan-Meier curve for OS between the three groups, showing no difference in OS between the groups (p = 0.902). Hash marks indicate censored cases