Fig. 5.
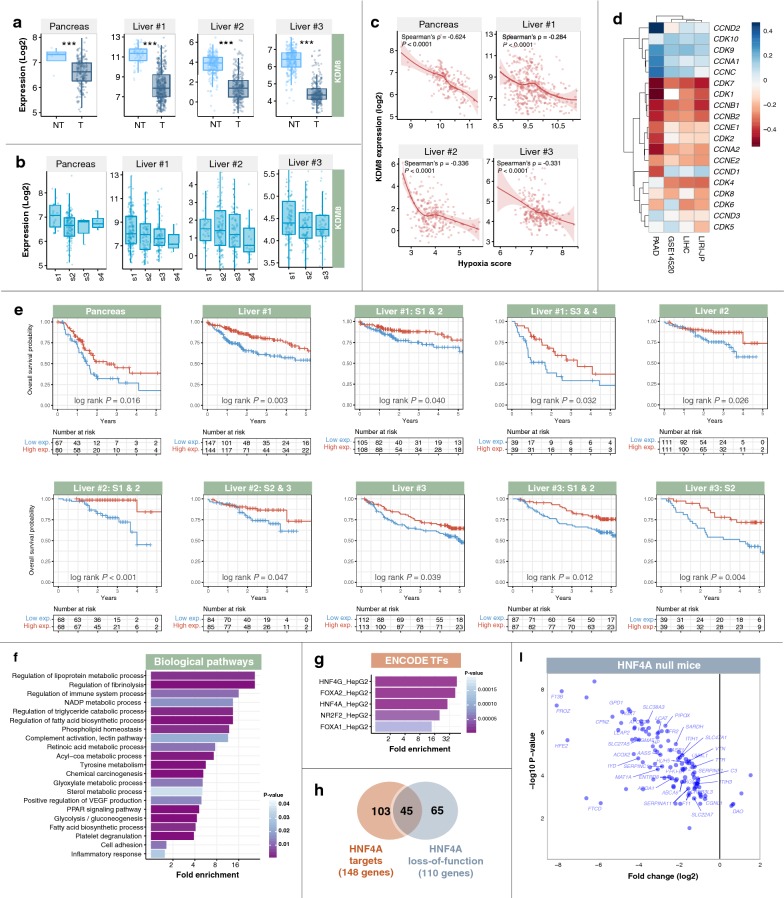
Putative tumor suppressive functions of KDM8 occur through processes related to cell cycle regulation and cell adhesion. a Expression of KDM8 was significantly lower in tumor (T) samples than in non-tumor (NT) samples in liver and pancreatic cancer cohorts. Mann–Whitney–Wilcoxon tests were used to compare T and NT samples. Asterisks represent significant P values: *** < 0.0001. b Expression levels of KDM8 decreased with disease progression and malignant grade in liver and pancreatic cancer cohorts. c Significant negative correlation between patients’ KDM8 expression and tumor hypoxia (hypoxia score) in liver and pancreatic cancer cohorts. d Correlation between KDM8 expression and canonical cell cycle regulators in patients with liver or pancreatic cancers. A majority of genes involved in cell-cycle regulation are negatively correlated with KDM8 expression. Liver #1 = LIHC cohort; Liver #2 = LIRI-JP cohort; and Liver #3 = GSE14520 cohort (Additional file 1). e Kaplan–Meier analysis of patients stratified by KDM8 expression. Patients were median-dichotomized into low- and high-expression groups. Patients with low KDM8 expression had significantly shorter overall survival. This was consistent in patients analyzed as a full cohort or sub-categorized according to TNM stage. Liver #1 = LIHC cohort; Liver #2 = LIRI-JP cohort; and Liver #3 = GSE14520 cohort (Additional file 1). f Patients were median-stratified according to KDM8 expression. Differential expression analysis between KDM8-high- and -low groups in liver cancer cohorts revealed 745 differentially expressed genes (DEGs; fold-change > 2 or < − 2). Enrichment of biological pathways associated with DEGs, which include processes related to cell adhesion, inflammation, metabolism, and signal transduction pathways in cancer. g Enrichment of transcription factors (TFs) from the ENCODE database that are potential regulators of KDM8 DEGs. These TFs were predicted to bind near KDM8 DEGs. h Venn diagram depicts the overlap between HNF4A targets (as identified by ENCODE chromatin-immunoprecipitation sequencing dataset) and genes affected by HNF4A loss-of-function (as identified in HNF4A-null mice). Of the 745 DEGs, 148 were identified as direct HNF4A targets, and 110 genes were affected by HNF4A loss-of-function. In the Venn intersection, 45 genes were both HNF4A targets and altered in HNF4A-null mice. i Scatter plot depicts expression patterns of 110 genes affected by HNF4A loss-of-function. Gene names of the 45 HNF4A targets are annotated on the plot. A majority of KDM8-associated genes were down-regulated in the HNF4A-null mice

