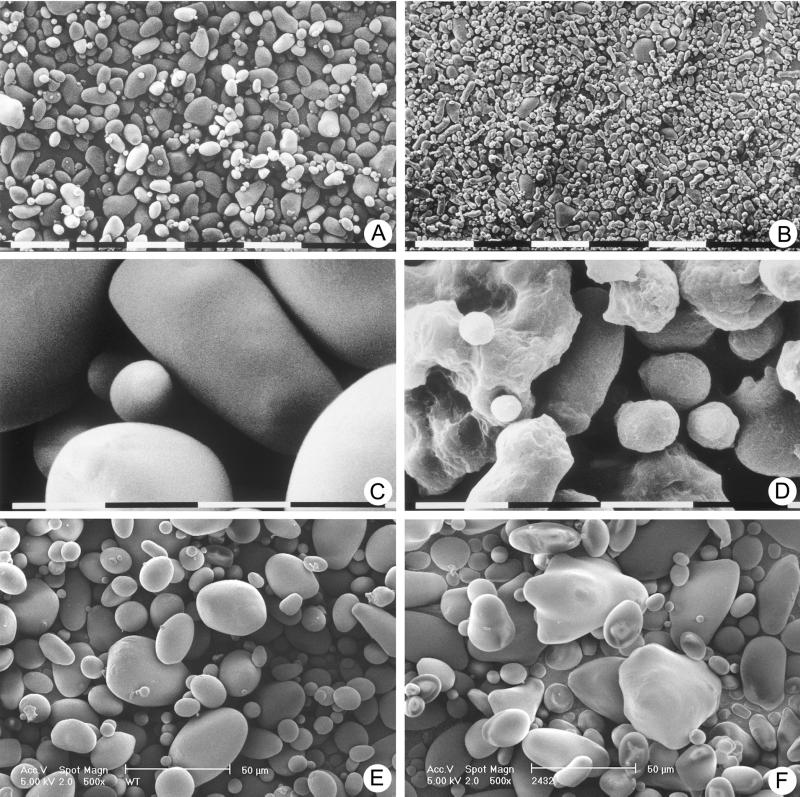
Figure 3.
SEM analysis of starch granules from potato tubers at magnifications of 150× (A and B), 2,400× (C and D), and 500× (E and F). Granules were isolated from WT tubers (A, C, and E) and 35S-FD-LS tubers containing 4.8% of dry weight fructan (B and D) and FD-INV tubers line 24–32 (F). The bar segments represent lengths of 100 μm (A and B), 10 μm (C and D), or 50 μm (E and F).

