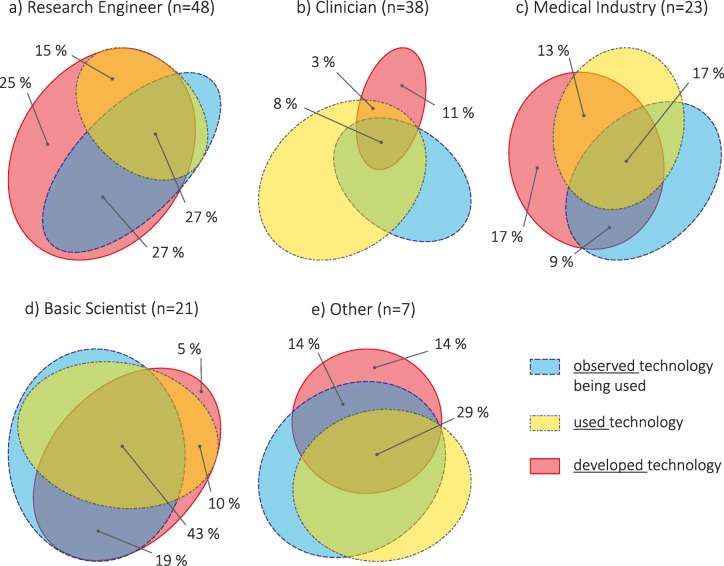
Fig. 5.
Exposure to technology-aided assessments – observed (blue, dashed outline), used (yellow, dash-dotted outline), and developed (red, solid outline) – per stakeholder group: a Research Engineer, b Clinician (two participants stated ‘no experience’), c Medical Industry (two participants stated ‘no experience’), d Basic Scientist, e Other. Areas proportional to counts within group; adapted from diagrams generated with [7]. We show the percentages associated to respondents who have developed technology (i.e. developed, developed AND observed, developed AND used, developed AND observed AND used) [Q5: What kind of exposure have you had with technology-aided assessments?]

