
Fig. 3.
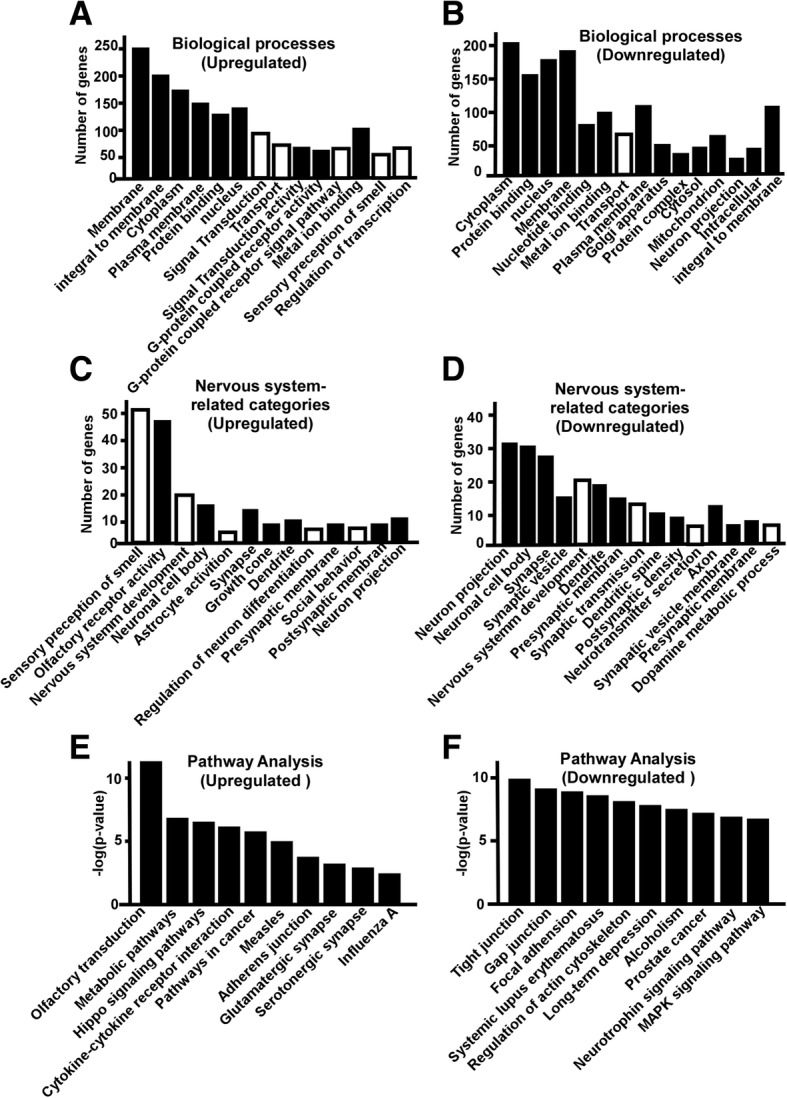
Gene Ontology and pathway analysis of the dysregulated genes in the hippocampus of S2P23 mice. a Significantly affect GO categories (Black bar) and subcategories (White bar) of biological process by upregulated genes are plotted, p < 0.05. b Significantly affect GO categories (Black bar) and subcategories (White bar) of biological process by downregulated genes are plotted, p < 0.05. c Nervous system related-Go categories affected by upregulated genes are plotted, p < 0.05. d Nervous system related-Go categories affected by downregulated genes are plotted, p < 0.05. e Pathways affected by upregulated genes are plotted, p < 0.05. f Pathways affected by downregulated genes are plotted, p < 0.05