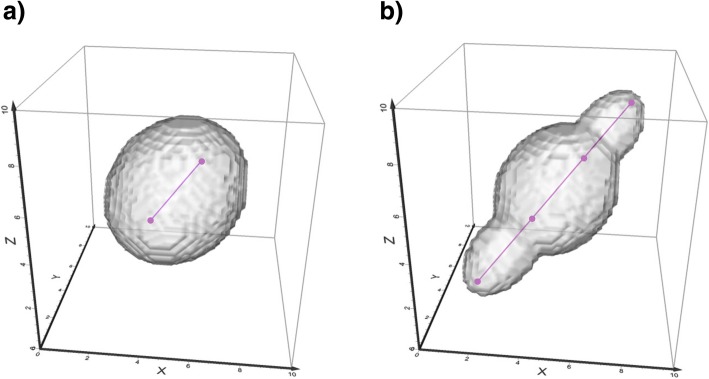
Fig. 3.
Calculation of the Potential Path Volume. The PPV is shown (a) around one trajectory segment and (b) around three segments, on which the speed on the first and last segment is higher than on the middle segment. This creates a wider PPV ellipsoid around the slower segment and narrower PPV ellipsoids around the faster segments

