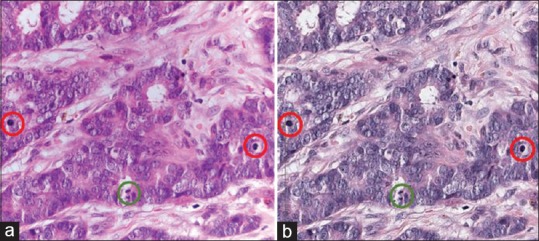
Figure 4.

Example Case #15 illustrating the difference in mitotic figures between formats. The mitotic scores and overall Nottingham grade scores presented for this case are based on interpretations from 46 pathologists using glass sides and 37 pathologists using digital whole slide images (Case #15 in Figure 3). (a) Photomicrograph of glass slide. N = 46 total interpretations on glass for PI + PII. Percent of total interpretations. Mitotic Count Score: (1) 7%, (2) 30%, (3) 63%. Nottingham grade: L: 20%, I: 74%, H: 7%. (b) Screen capture of digital slide viewer. N = 37 total interpretations on digital for PI + PII. Percent of total interpretations. Mitotic Count Score: (1) 32%, (2) 54%, (3) 14%. Nottingham grade: L: 57%, I: 38%, H: 5%. Green circles: Clear mitotic figure in both formats. Red circles: Mitotic figures seen clearly on glass when using z-plane focus but appearing as lymphocytes on digital format. (Note that the photomicrograph does not fully capture the clarity of mitotic figures that was seen on microscopy using z-plane focus)
