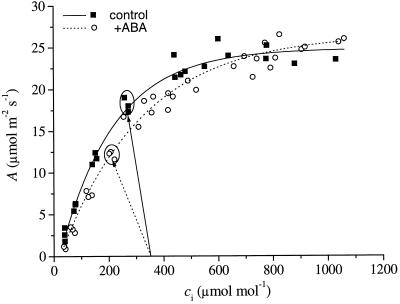
Figure 1.
Plot of A against ci for control and ABA-treated plants. Data are the combined results for three control and three ABA-treated plants. Solid and dotted lines are nonlinear least-squares fits of first-order exponential decay functions to data for control and ABA-treated plants, respectively (y = 24.8 − 27.4e(−x/198), r2 = 0.99 for control; y = 26.5 − 28.5e(−x/300), r2 = 0.98 for ABA-treated plants). Solid and dotted arrows point to initial operating points (circled) for control and ABA-treated plants, respectively (ca = 350 μmol mol−1, vapor-pressure difference [VPD] = 1.0 kPa). Leaf temperature 25°C, photosynthetically active radiation 800 μmol m−2 s−1.

