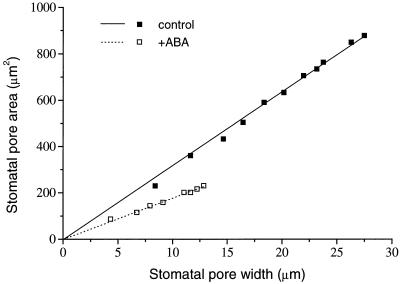
Figure 4.
The relationship between stomatal pore area a ' (μm2) and stomatal pore width a (μm), as measured for typical stomata from control and ABA-treated T. virginiana plants. Solid and dotted lines are linear regressions of a ' on a for control and ABA-treated plants, respectively. For control, a ' = 31.7a, r2 = 0.998; for ABA-treated plants, a ' = 17.8a, r2 = 0.991.

