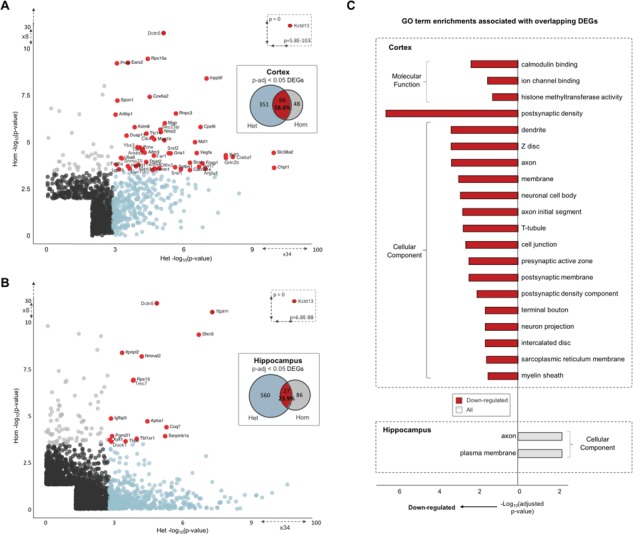
Figure 4.

DEGs and associated enriched GO pathways. Cortex (A) and hippocampus (B) significant DEGs. The −log10P-values for significant (P-nominal < 0.05) protein-coding Het DEGs (x-axis) are plotted against Hom DEGs (y-axis). Het DEGs that reach significance at adjusted thresholds (P-adj < 0.05) are colored in blue, and Hom DEGs in gray. Overlapping adjusted significant DEGs across genotype comparisons are colored in red and gene names given. (C) Significant GO term enrichments (P-adj < 0.05) for overlapping Het and Hom DEGs (P-value < 0.05) for cortex and hippocampus. Red shading indicates terms associated with downregulated DEGs, and blue for upregulated terms. GO term categories are given outside of brackets.
