
Figure 2.
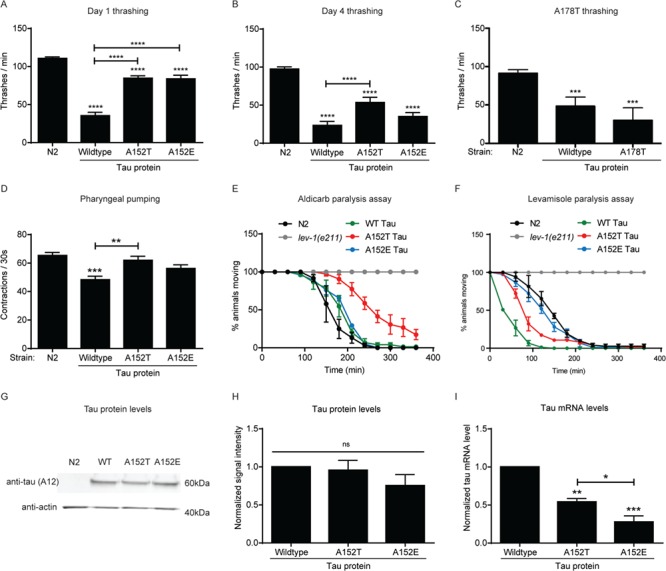
The A152T tau variant impairs synaptic transmission in adult C. elegans. (A) Measurement of the number of thrashes per minute for day 1 adult animals (n = 12, 3 biological replicates). (B) Measurement of the number of thrashes per minute for day 4 adult animals (n = 12, 3 biological replicates). (C) Measurement of the number of thrashes per minute for day 1 adult A178T tau-expressing animals (n = 8, 3 biological replicates). (D) Measurement of pharyngeal pumping per 30 s for day 1 adult animals (n = 10, 3 biological replicates). (E) Time-dependent aldicarb paralysis (n = 25, 3 biological replicates). Two-way ANOVA with Dunnett multiple comparisons test to WT non-transgenic animals. P < 0.05 at time point 150 min for WT tau, P < 0.001 at time point 180 min for WT tau, P < 0.0001 at time points 150–270 min for A152T tau, P < 0.001 at time point 300 min for A152T tau, P < 0.01 at time point 330 min for A152T tau, P < 0.0001 at time point 180 min for A152E tau. (F) Time-dependent levamisole paralysis (n = 25, 3 biological replicates). Two-way ANOVA with Dunnett multiple comparisons test to WT non-transgenic animals. P < 0.0001 at time points 90–150 min for WT and A152T tau, P < 0.01 at time point 180 min for WT tau, P < 0.001 at time point 60 min for A152T tau, P < 0.01 at time point 150 min for A152E tau. Worms lacking a functional nicotinic acetylcholine receptor (lev-1) are resistant to both aldicarb and levamisole and were used as a negative control in paralysis assays. (G) Representative western blot of lysates from N2 control animals and animals expressing WT, A152T or A152E tau. Total tau level was immunoblotted with Tau A12 antibody. (H) Quantification of total tau protein levels from western blot (three biological replicates). (I) Quantification of tau mRNA levels (three biological replicates). Statistical tests for all panels are one-way ANOVA with Tukey’s multiple comparisons test unless otherwise stated. Error bars represent SEM. * = P < 0.05, ** = P < 0.01, *** = P < 0.001, **** = P < 0.0001.