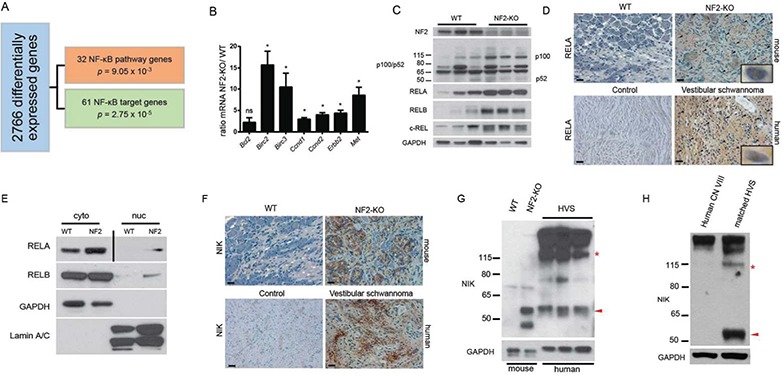
Figure 1.

NF-κB pathway activation in schwannomas. (A) IPA of human schwannoma microarray data identifies 2766 differentially regulated genes in the tumor tissue, 93 of which are NF-κB signaling elements and target genes. (B) Validation of deregulated NF-κB genes by qRT-PCR in primary nerve tissues (WT n = 3; NF2-KO n = 3). ns = not significant, *p < 0.05. Unpaired Student’s t-test with Holm–Sidak correction for multiple comparisons, α = 0.05. Error bars represent standard error of the mean (SEM). (C) IB demonstrating increased NF-κB transcription factors and signaling elements in NF2-KO nerve tissues. (D) IHC of RELA in murine (upper) and human (lower) tissues. Scale bar = 20 μm. Original magnification ×400. Arrowheads point to representative nuclei with positive staining for RELA. 1000× insets are examples of positive nuclear staining. (E) IB of fractionated primary nerve tissue from WT and NF2-KO mice demonstrating increased cytoplasmic and nuclear levels of RELA and RELB proteins. Vertical bar indicates different exposures. NF2 = NF2-KO, cyto = cytoplasmic fraction, nuc = nuclear fraction. (F) IHC of NIK in murine (upper) and human (lower) tissues. Scale bar = 20 μm. Original magnification ×400. (G) IB demonstrating the accumulation of fragments of the kinase domain of NIK including a 55 kDa fragment (red arrowhead). Full-length NIK can be identified by the red asterisk at ∼120 kDa. HVS = spontaneous human vestibular schwannoma. (H) IB of primary HVS with matching control CN VIII tissues from the surrounding nerve in the same patient.
