Figure 4.

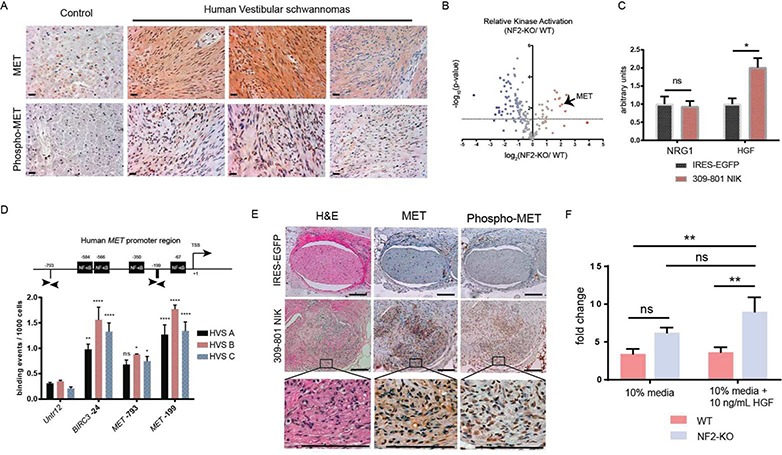
NIK and NF-κB regulate pathologic activation of MET signaling in schwannomas. (A) IHC of MET and Phospho-MET in human nerve tissue and three distinct HVS. Scale bar = 20 μm. Original magnification ×400. Arrowheads point to representative cells with positive staining for Phospho-MET. (B) Kinome analysis in primary murine tissues demonstrating a nearly 4-fold statistically significant increase in MET activation in schwannomas. The dotted line indicates a false discovery rate of 5% (Benjamini–Hochberg correction). (C) ELISA of SC-conditioned medium collected after 96 h of incubation. (D) ChIP-qPCR of human MET promoter region with an antibody targeting RELA. The graph displays the MET promoter region and PCR primers flanking locations at −199 and −793. Untr12 primers serve as a negative control and BIRC3 as a positive control. TSS = transcriptional start site. (E) Serial sections of IRES- and NIK-injected nerves stained with H&E, MET and Phospho-MET from the experiment outlined in Figure 3H. Original magnification ×100, magnified inset 400×. Scale bar = 100 μm. (F) In vitro cell counting assay with primary NF2-KO and WT murine schwannoma/SCs over 10 days. [Unpaired Student’s t-test with Holm–Sidak correction for multiple comparisons (α = 0.05; C). Two-way ANOVA with Dunnett’s test for post hoc comparisons (α = 0.05, D and F). ns = not significant, *P < 0.05, **P < 0.01, ***P < 0.001, ****P < 0.0001. Error bars represent SEM. All experiments with statistical testing were performed in triplicate.]
