
Figure 4.
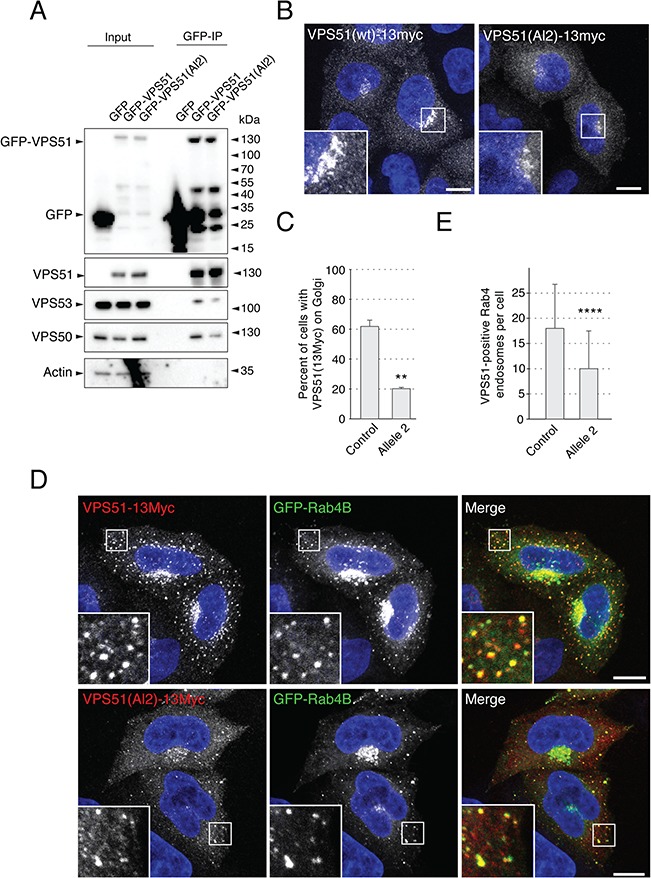
The VPS51(Al2) mutant protein is stable but assembles less efficiently into GARP and EARP. (A) Extracts from HeLa cells transiently transfected with plasmids encoding GFP, GFP-VPS51 or GFP-VPS51(Al2) were analyzed by pull down with a nanobody to GFP conjugated to magnetic beads, followed by SDS-PAGE and IB for GFP, endogenous GARP/EARP subunits and actin (loading and negative control). Positions of molecular mass markers are indicated on the right. Notice the similar levels of GFP-VPS51 and GFP-VPS51(Al2) and the decreased co-immunoprecipitation of VPS53 and VPS50 with GFP-VPS51(Al2). (B) HeLa cells were transiently transfected with plasmids encoding VPS51-13myc, immunostained for the myc epitope and imaged by confocal microscopy. (C) Quantification of the percentage of cells with VPS51-13myc staining at the TGN. Over 300 cells across 3 different independent experiments (over 100 cells per experiment per sample) were classified as having either residual TGN localization or no observable TGN localization. Percentages were calculated and compared with a one-tailed paired t-test, P = 0.0014. VPS51-13myc displayed a perinuclear (TGN) localization in >60% of the transfected cells, whereas VPS51(Al2)-13myc showed a mostly cytosolic localization, with only ~20% of cells having observable residual perinuclear staining. Moreover, VPS51(Al2)-13myc staining at the TGN was less intense than that of VPS51-13myc in comparable cells. (D) HeLa cells were transiently co-transfected with plasmids encoding GFP-Rab4B together with VPS51-13myc or VPS51(Al1)-13myc, immunostained for the myc epitope and imaged by confocal microscopy. (E) Quantification of the number of GFP-Rab4B-positive endosomes that also contained VPS51-13myc or VPS51(Al1)-13myc. VPS51-positive Rab4B endosomes in 62 cells (WT VPS51) and 64 cells (allele 2), from images taken across 3 independent experiments were counted. Data sets were compared with a t-test, P = 5.5 × 10⁻⁷. Notice that GFP-Rab4B caused recruitment of VPS51-13myc. GFP-Rab4B also caused VPS51(Al2)-13myc recruitment to endosomes but the number of endosomes was smaller and there was more cytosolic background. In B and D, nuclear staining by DAPI is shown in blue. Single channels are shown in grayscale. In the merged images in D, myc staining is shown in red and GFP fluorescence is shown in green. Scale bars, 10 μm; inset scale bars, 2 μm; error bars = standard deviation.