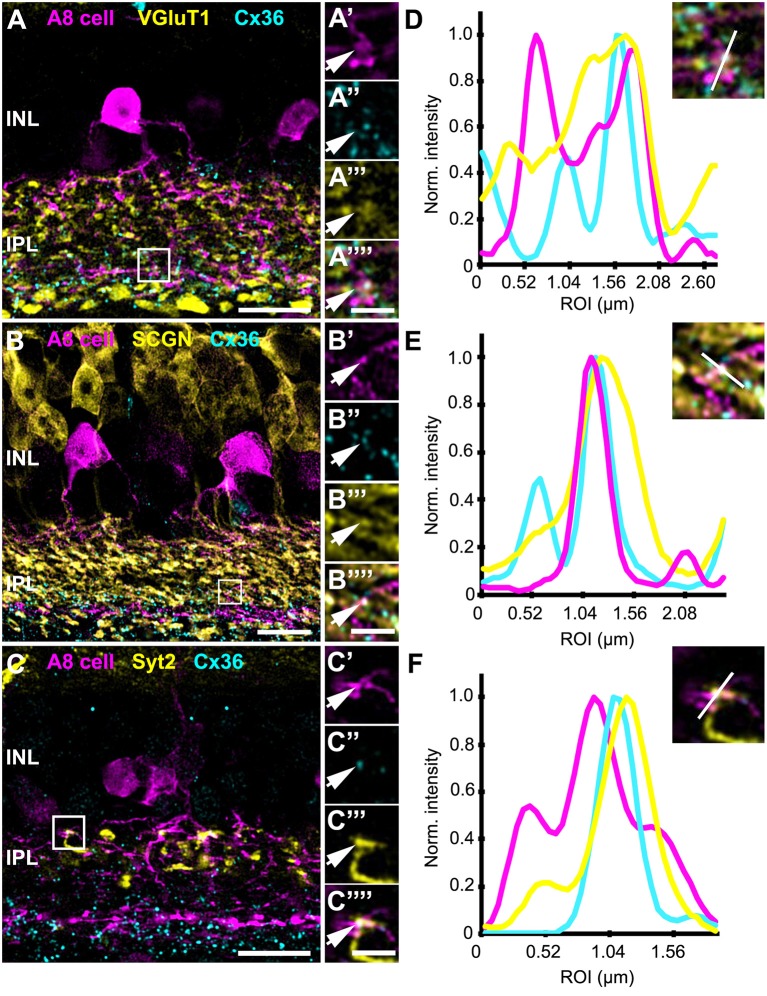
Figure 5.
Co-localization of A8 gap junctions with bipolar cell terminals in vertical sections. (A–C) Single retinal slices of Ier5-EGFP (A8 cell) mouse stained with Cx36 and bipolar cell markers: VGluT1 (A), secretagogin [(B), SCGN], and synaptotagmin-2 [(C), Syt2]. Square white boxes in (A–C) are the selected ROIs shown in (A'–C””). Arrows denote co-localization of all the three channels which is also represented in the normalized intensity plots (D–F). (D–F) Intensity plot for three channels, corresponding to (A–C). The respective inset represents the single scan overlay of the three channels. The plot denotes normalized pixel intensity of three channels in y-axis, and the x-axis represents the relative distance of peak intensities of the three individual channels. Scale bar: (A–C), 10 μm; (A'–C””), 2.5 μm.

