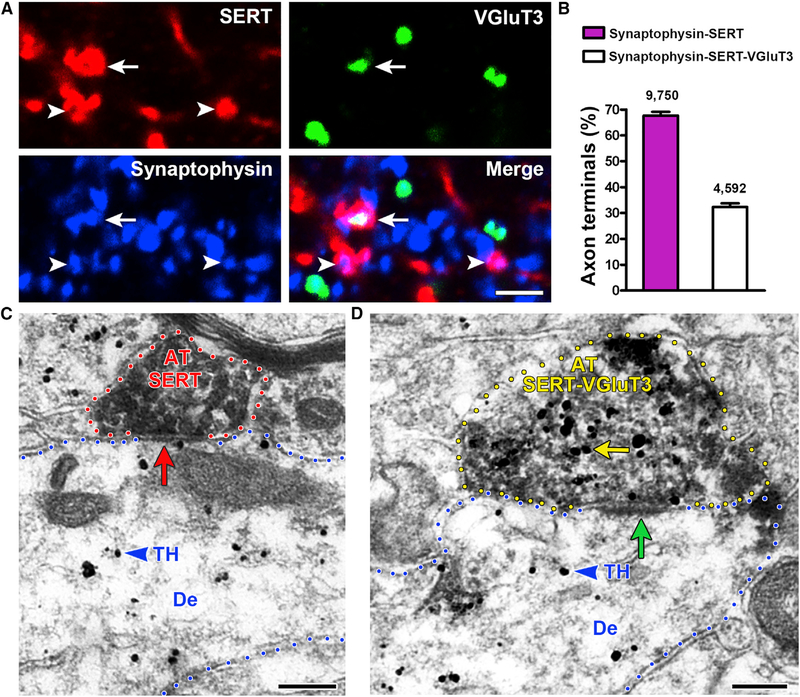
Figure 1. Both SERT-Only and SERT-VGluT3 Neurons Synapse on VTA TH Neurons.
(A) VTA detection of SERT (red), VGluT3 (green), or synaptophysin (blue). Synaptophysin terminals with SERT (arrowheads) or SERT-VGluT3 (arrow).
(B) VTA frequency of synaptophysin-SERT and synaptophysin-SERT-VGluT3 terminals; bars represent means ± SEM (four mice, 14,342 counted terminals; 67.66% ± 1.43% synaptophysin-SERT and 32.34% ± 1.43% synaptophysin-SERT-VGluT3). Paired t test, t(3) = 12.33, p = 0.0011.
(C and D) SERT-only (C) or SERT-VGluT3 (D) axon terminals (AT) make synapses on VTA TH-positive neurons. Triple immunolabeling: TH label (gold particles, blue arrowheads); SERT-immunoperoxidase label (scattered dark material) and VGluT3 label (gold particles, yellow arrow).
(C) SERT AT lacking VGluT3 (red outline) makes a symmetric synapse (red arrow) with a TH dendrite (De).
(D) SERT-VGluT3 AT (yellow outline) makes an asymmetric synapse (green arrow) with a TH dendrite.
Scale bars: 2 μm (A) and 200 nm (C and D).

