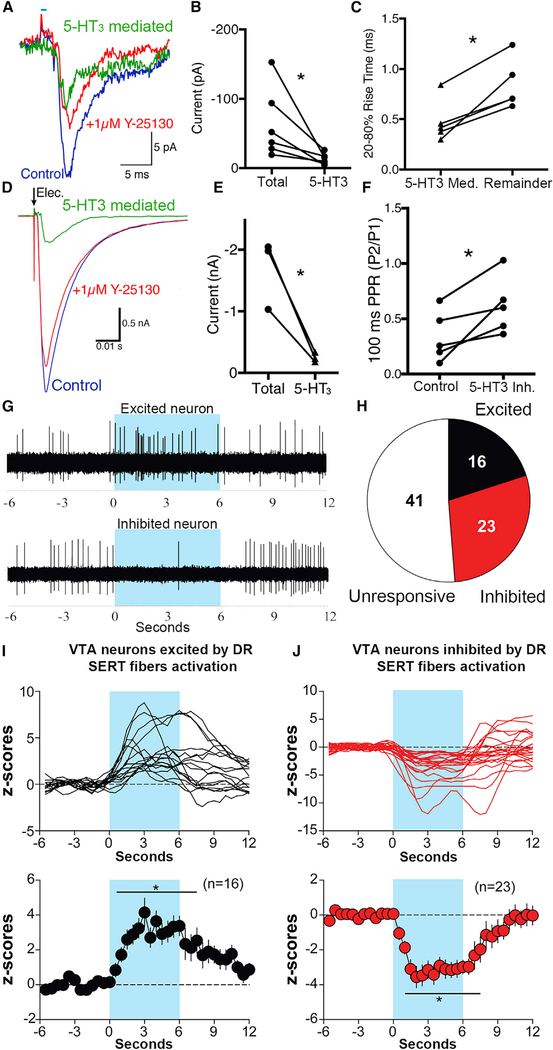
Figure 3. VTA Optical Stimulation of SERT Terminals Expressing ChR2 Evokes 5-HT3 Mediated EPSCs on Dopamine Neurons.
(A-F) VTA slice electrophysiological recordings.
(A) Whole-cell recording of a VTA DA neuron during optical stimulation of DR inputs before (blue) and after (red) blocking 5-HT3 receptors. In green is the current mediated by 5-HT3 receptors (red trace subtracted from blue trace).
(B) Summarized data of the total current and the current mediated by 5-HT3 receptors from optical stimulation (paired t test, t(5) = 3.432, *p = 0.019, n = 6).
(C) Summarized difference in rise time between the 5-HT3-mediated current from optical stimulation and the current remaining after 5-HT3 receptor blockade (*, significantly different from remainder, one-way repeated-measures ANOVA, F2,8 = 16.72, *p = 0.0014; n = 5).
(D) Whole-cell recording of a VTA DA neuron and electrical stimulation inputs before (blue) and after (red) blocking 5-HT3 receptors. In green is current mediated by 5-HT3 receptors.
(E) Summarized total current and current mediated by 5-HT3 receptors from electrical stimulation (paired t test, t(2) = 4.848, *p = 0.04, n = 3).
(F) Blocking 5-HT3 receptors changes the paired pulse ratio from optical stimulation (paired t test, t(4) = 3.2, *p = 0.033, n = 5). Data are represented as every data point of nine cells from four different animals.
(G and H) Activation of DR inputs evokes excitation or inhibition of VTA neurons.
(G) Original recording of VTA, with top trace showing an excited neuron, and bottom trace showing an inhibited neuron. Blue bars indicate the duration of photoactivation of DR fibers within the VTA.
(H) Proportion of evoked neural responses.
(I) VTA neurons excited by DR-SERT input activation. Top shows responses of individual neurons, and bottom shows population average (*, significantly different from prestimulation, one-way repeated-measures ANOVA, Greenhouse-Geisser corrected, F4,61 = 5.55, p = 0.00065; Neuman-Keuls post hoc test, *p < 0.05; see p value at each time point in Table S2).
(J) VTA neurons inhibited by photoactivation of DR-SERT fibers. Top shows responses of individual neurons, and bottom shows population average (*, significantly different from prestimulation, one-way repeated-measures ANOVA, Greenhouse-Geisser corrected, F4,81 = 10.16, p = 0.000001; Neuman-Keuls post hoc test, *p<0.05; seep value at each time point in Table S2). Blue bars indicate the duration of photoactivation of DR.

