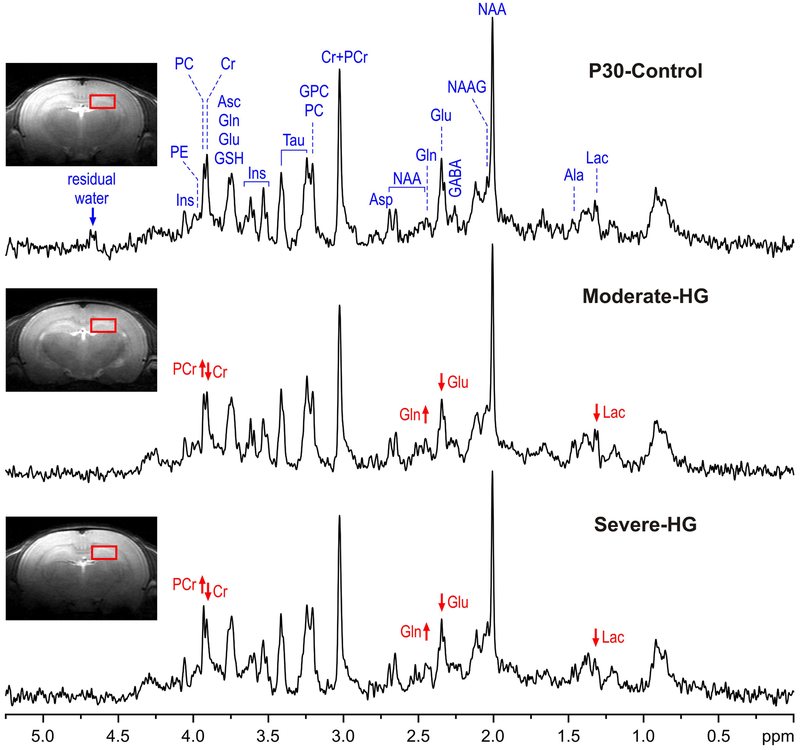
Figure 1.
Representative in vivo 1H MR spectra acquired from the hippocampus of the control (P30-Control), moderate hyperglycemia (Moderate-HG) and severe hyperglycemia (Severe-HG)) rats at postnatal day 30 (STEAM, Te = 2 ms, TR = 5 s, NT = 240). Axial and sagittal FSE images show the typical selection of the 8 μl VOI in the dorsal hippocampus. Arrows show the direction of changes in creatine (Cr), phosphocretine (PCr), glutamine (Gln), glutamate (Glu) and lactate (Lac) in the two hyperglycemia groups, relative to the control group. Abbreviations: Ala, alanine; Asc, ascorbate; Asp, aspartate; GABA, γ-aminobutyric acid; GSH, glutathione; GPC, glycerophosphocholine; Ins, myo-inositol; Lac, lactate; NAA, N-acetylaspartate; NAAG, N-acetylaspartylglutamate; PC, phosphocholine; PE, phosphoethanolamine; Tau, taurine.

