
Figure 3.
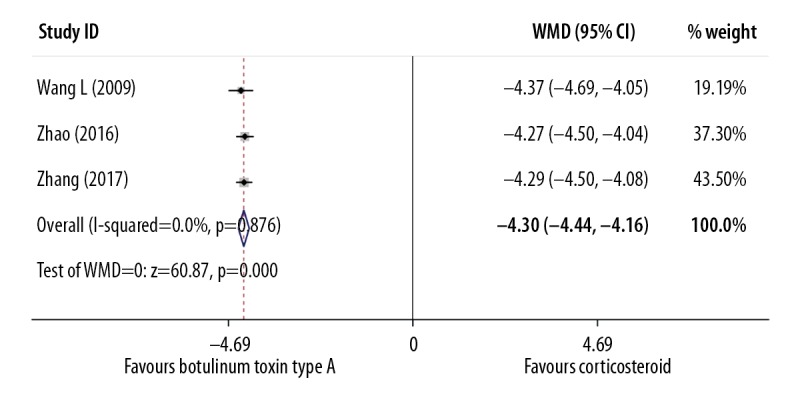
Forest plot to compare the visual analog scale (VAS) findings between the group treated with intralesional injection of botulinum toxin type A and the group treated with intralesional injection of corticosteroid.
Official websites use .gov
A
.gov website belongs to an official
government organization in the United States.
Secure .gov websites use HTTPS
A lock (
) or https:// means you've safely
connected to the .gov website. Share sensitive
information only on official, secure websites.
Forest plot to compare the visual analog scale (VAS) findings between the group treated with intralesional injection of botulinum toxin type A and the group treated with intralesional injection of corticosteroid.