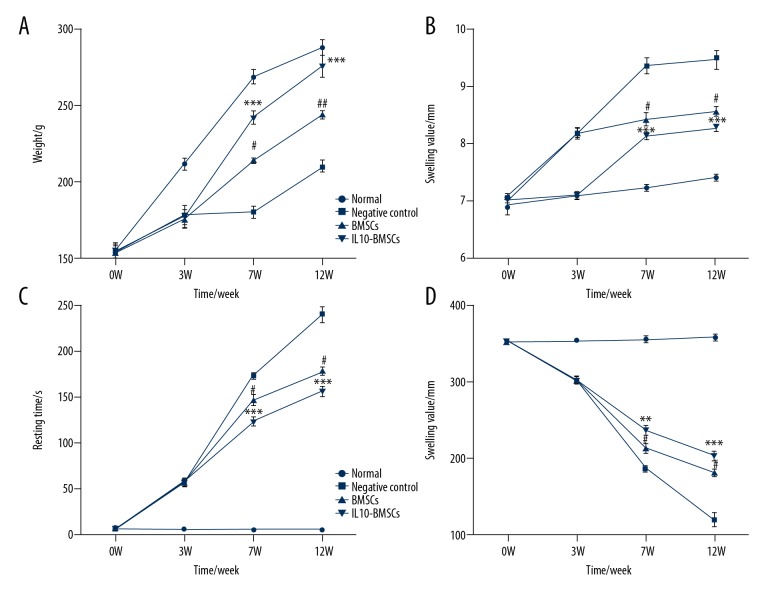
Figure 2.
Results of rat weight, swollen ankle, and forced swimming test. (A) Changes in body weight at different time in different groups of rats. (B) Changes in swelling of ankle joints at different times in different groups of rats. (C, D) Rat resting time (C) and struggling time (D) in forced swimming test. Compared with negative control group, # P<0.05, ## P<0.01, and ### P<0.001. Compared with BMSCs group, * P<0.05, ** P<0.01, *** P<0.001.

