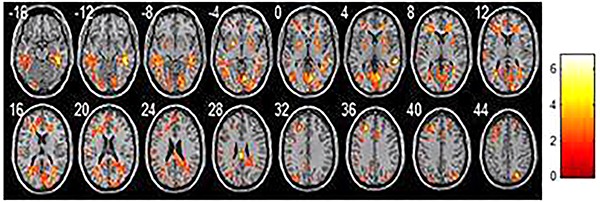
Figure 3. Regions where homogeneity decreased in the amnestic mild cognitive impairment group compared with the normal elderlies. Each image represents a slice, with 4 mm distance from the other. 0 is the 0 position of space coordinates. The color bar indicates energy intensity.

