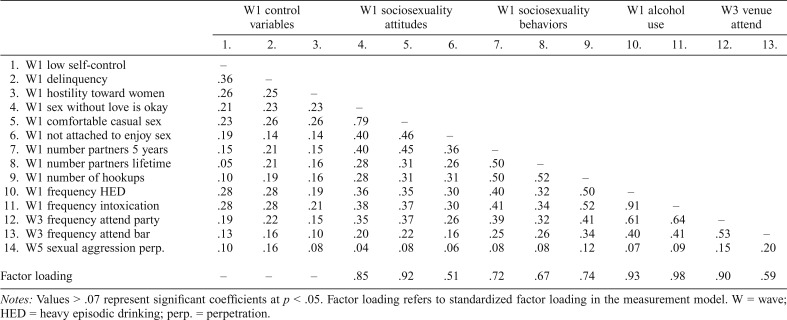
Table 2.
Inter-item correlations and factor loadings among the study variables
| W1 control variables |
W1 sociosexuality attitudes |
W1 sociosexuality behaviors |
W1 alcohol use |
W3 venue attend |
|||||||||
| 1. | 2. | 3. | 4. | 5. | 6. | 7. | 8. | 9. | 10. | 11. | 12. | 13. | |
| 1. W1 low self-control | – | ||||||||||||
| 2. W1 delinquency | .36 | – | |||||||||||
| 3. W1 hostility toward women | .26 | .25 | – | ||||||||||
| 4. W1 sex without love is okay | .21 | .23 | .23 | – | |||||||||
| 5. W1 comfortable casual sex | .23 | .26 | .26 | .79 | – | ||||||||
| 6. W1 not attached to enjoy sex | .19 | .14 | .14 | .40 | .46 | – | |||||||
| 7. W1 number partners 5 years | .15 | .21 | .15 | .40 | .45 | .36 | – | ||||||
| 8. W1 number partners lifetime | .05 | .21 | .16 | .28 | .31 | .26 | .50 | – | |||||
| 9. W1 number of hookups | .10 | .19 | .16 | .28 | .31 | .31 | .50 | .52 | – | ||||
| 10. W1 frequency HED | .28 | .28 | .19 | .36 | .35 | .30 | .40 | .32 | .50 | – | |||
| 11. W1 frequency intoxication | .28 | .28 | .21 | .38 | .37 | .30 | .41 | .34 | .52 | .91 | – | ||
| 12. W3 frequency attend party | .19 | .22 | .15 | .35 | .37 | .26 | .39 | .32 | .41 | .61 | .64 | – | |
| 13. W3 frequency attend bar | .13 | .16 | .10 | .20 | .22 | .16 | .25 | .26 | .34 | .40 | .41 | .53 | – |
| 14. W5 sexual aggression perp. | .10 | .16 | .08 | .04 | .08 | .06 | .08 | .08 | .12 | .07 | .09 | .15 | .20 |
| Factor loading | – | – | – | .85 | .92 | .51 | .72 | .67 | .74 | .93 | .98 | .90 | .59 |
Notes: Values > .07 represent significant coefficients at p < .05. Factor loading refers to standardized factor loading in the measurement model. W = wave; HED = heavy episodic drinking; perp. = perpetration.

