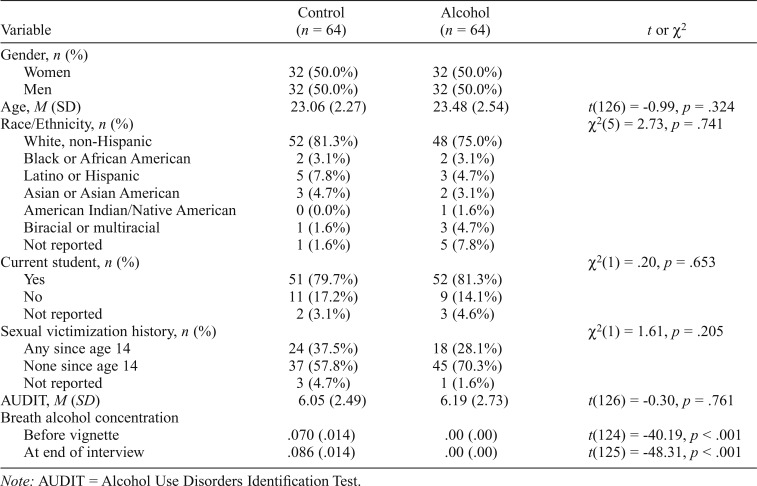
Table 1.
Demographic variables and differences across conditions
| Variable | Control (n = 64) | Alcohol (n = 64) | t or χ2 |
| Gender, n (%) | |||
| Women | 32 (50.0%) | 32 (50.0%) | |
| Men | 32 (50.0%) | 32 (50.0%) | |
| Age, M (SD) | 23.06 (2.27) | 23.48 (2.54) | t(126) = -0.99, p = .324 |
| Race/Ethnicity, n (%) | χ2(5) = 2.73, p = .741 | ||
| White, non-Hispanic | 52 (81.3%) | 48 (75.0%) | |
| Black or African American | 2 (3.1%) | 2 (3.1%) | |
| Latino or Hispanic | 5 (7.8%) | 3 (4.7%) | |
| Asian or Asian American | 3 (4.7%) | 2 (3.1%) | |
| American Indian/Native American | 0 (0.0%) | 1 (1.6%) | |
| Biracial or multiracial | 1 (1.6%) | 3 (4.7%) | |
| Not reported | 1 (1.6%) | 5 (7.8%) | |
| Current student, n (%) | χ2(1) = .20, p = .653 | ||
| Yes | 51 (79.7%) | 52 (81.3%) | |
| No | 11 (17.2%) | 9 (14.1%) | |
| Not reported | 2 (3.1%) | 3 (4.6%) | |
| Sexual victimization history, n (%) | χ2(1) = 1.61, p = .205 | ||
| Any since age 14 | 24 (37.5%) | 18 (28.1%) | |
| None since age 14 | 37 (57.8%) | 45 (70.3%) | |
| Not reported | 3 (4.7%) | 1 (1.6%) | |
| AUDIT, M (SD) | 6.05 (2.49) | 6.19 (2.73) | t(126) = -0.30, p = .761 |
| Breath alcohol concentration | |||
| Before vignette | .070 (.014) | .00 (.00) | t(124) = -40.19, p < .001 |
| At end of interview | .086 (.014) | .00 (.00) | t(125) = -48.31, p < .001 |
Note: AUDIT = Alcohol Use Disorders Identification Test.

