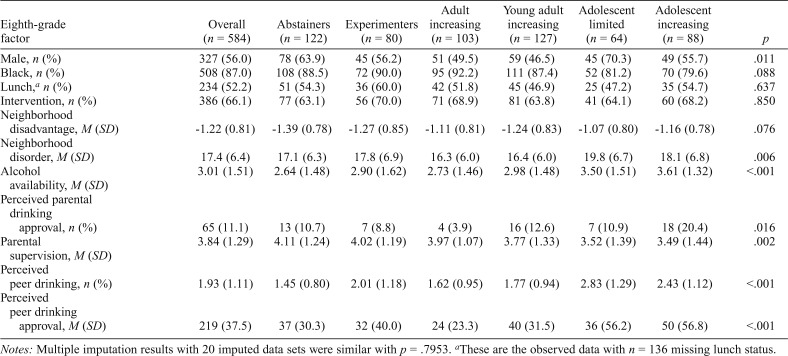
Table 2.
Individual, neighborhood, family and peer factors by alcohol trajectory group
| Eighth-grade factor | Overall (n = 584) | Abstainers (n = 122) | Experimenters (n = 80) | Adult increasing (n = 103) | Young adult increasing (n = 127) | Adolescent limited (n = 64) | Adolescent increasing (n = 88) | p |
| Male, n (%) | 327 (56.0) | 78 (63.9) | 45 (56.2) | 51 (49.5) | 59 (46.5) | 45 (70.3) | 49 (55.7) | .011 |
| Black, n (%) | 508 (87.0) | 108 (88.5) | 72 (90.0) | 95 (92.2) | 111 (87.4) | 52 (81.2) | 70 (79.6) | .088 |
| Lunch,a n (%) | 234 (52.2) | 51 (54.3) | 36 (60.0) | 42 (51.8) | 45 (46.9) | 25 (47.2) | 35 (54.7) | .637 |
| Intervention, n (%) | 386 (66.1) | 77 (63.1) | 56 (70.0) | 71 (68.9) | 81 (63.8) | 41 (64.1) | 60 (68.2) | .850 |
| Neighborhood disadvantage, M (SD) | -1.22 (0.81) | -1.39 (0.78) | -1.27 (0.85) | -1.11 (0.81) | -1.24 (0.83) | -1.07 (0.80) | -1.16 (0.78) | .076 |
| Neighborhood disorder, M (SD) | 17.4 (6.4) | 17.1 (6.3) | 17.8 (6.9) | 16.3 (6.0) | 16.4 (6.0) | 19.8 (6.7) | 18.1 (6.8) | .006 |
| Alcohol availability, M (SD) | 3.01 (1.51) | 2.64 (1.48) | 2.90 (1.62) | 2.73 (1.46) | 2.98 (1.48) | 3.50 (1.51) | 3.61 (1.32) | <.001 |
| Perceived parental drinking approval, n (%) | 65 (11.1) | 13 (10.7) | 7 (8.8) | 4 (3.9) | 16 (12.6) | 7 (10.9) | 18 (20.4) | .016 |
| Parental supervision, M (SD) | 3.84 (1.29) | 4.11 (1.24) | 4.02 (1.19) | 3.97 (1.07) | 3.77 (1.33) | 3.52 (1.39) | 3.49 (1.44) | .002 |
| Perceived peer drinking, n (%) | 1.93 (1.11) | 1.45 (0.80) | 2.01 (1.18) | 1.62 (0.95) | 1.77 (0.94) | 2.83 (1.29) | 2.43 (1.12) | <.001 |
| Perceived peer drinking approval, M (SD) | 219 (37.5) | 37 (30.3) | 32 (40.0) | 24 (23.3) | 40 (31.5) | 36 (56.2) | 50 (56.8) | <.001 |
Notes: Multiple imputation results with 20 imputed data sets were similar with p = .7953.
These are the observed data with n = 136 missing lunch status.

