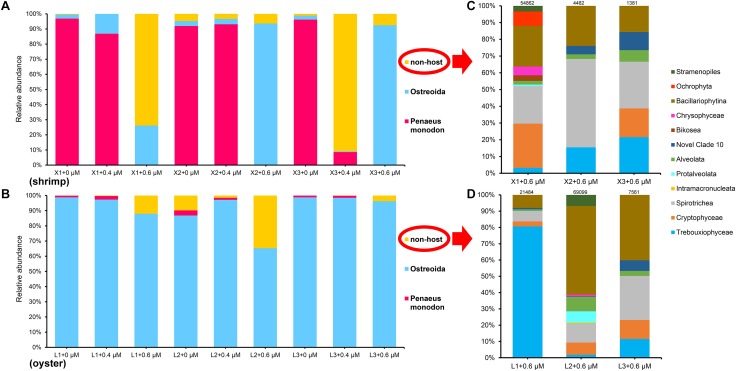
FIGURE 2.
The taxonomic composition of eukaryotic microorganisms in shrimp (A,C) and oyster (B,D) amplified with the blocking primer at various concentrations. C and D, details of class composition of “non-host” in shrimp and oyster samples (the relative abundance of ASVs >0.01%) when the primer concentration is 0.6 μM. Numbers above each bar chart are reads counts, and were all grouped in class level. “+0,” “+0.4,” and “+0.6 μM” implying that the samples were amplified with the blocking primer, X-BP2-DPO, at different concentrations. “X1-3” and “L1-3” are six different shrimp and oyster samples, respectively.

