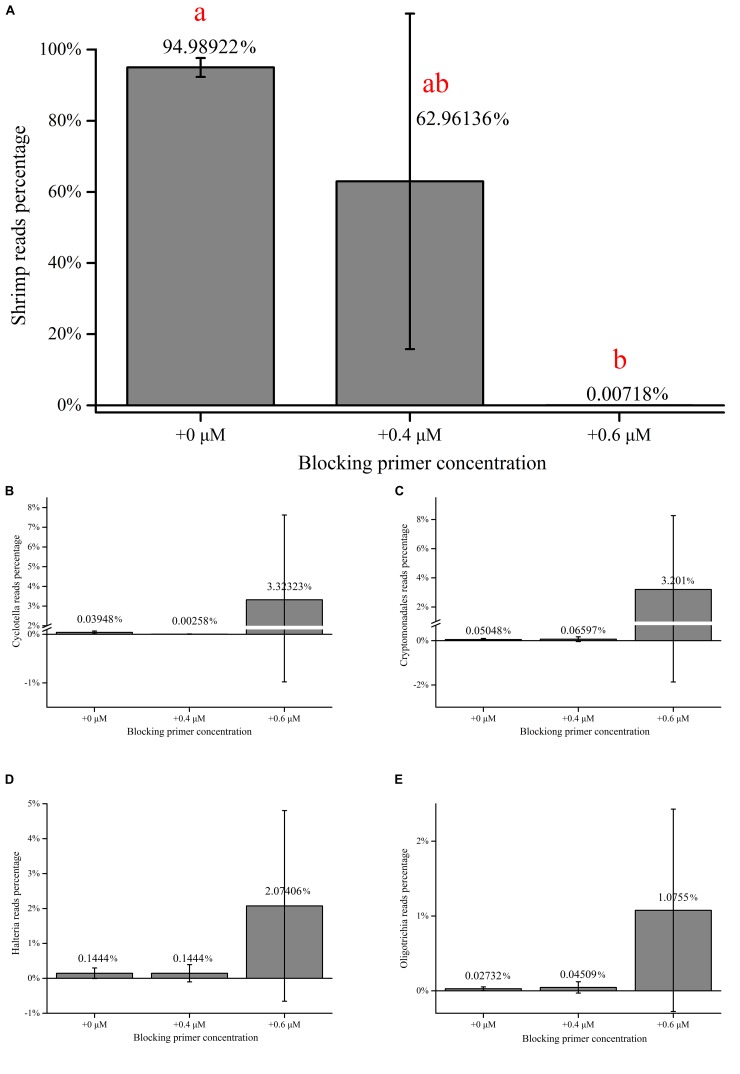
FIGURE 3.
Changes in the percentage of taxa in shrimp samples. (A) Changes in the percentage of host reads in shrimp samples amplified with the blocking primer, X-BP2-DPO at various concentrations. (B–E) Changes in percentage of the four dominant eukaryotes reads [Cyclotella (B), Cryptomonadales (C), uncultured Halteria (D), and Oligotrichia (E)] in shrimp samples amplified with the blocking primer, X-BP2-DPO at various concentrations. “+0,” “+0.4,” and “+0.6 μM” imply that the samples were amplified with the blocking primer, X-BP2-DPO at the concentrations of 0, 0.4, and 0.6 μM in the PCRs. The data was analyzed by applying Tukey’s test and Levene’s test (p = 0.013).

