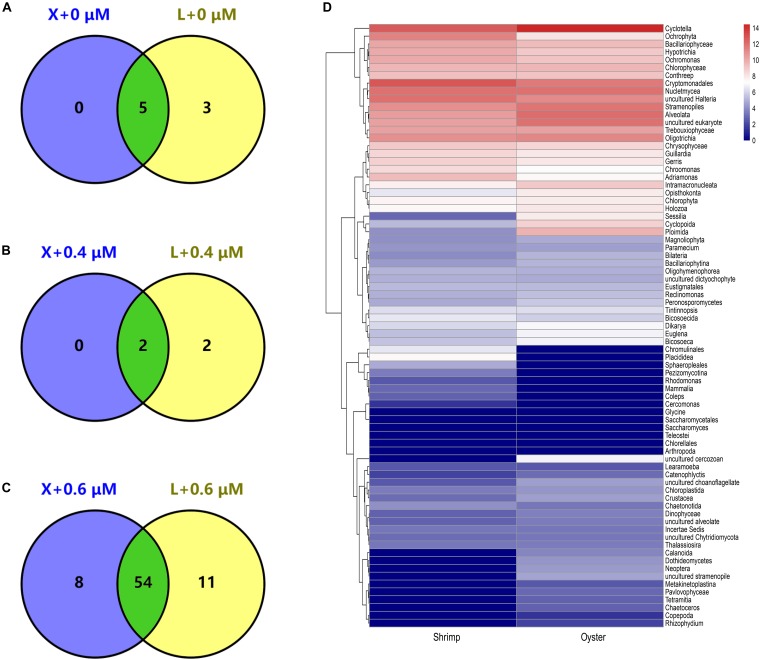
FIGURE 4.
Detected genus of eukaryotic microorganisms shared between shrimp and oyster samples. “X” and “L” represent shrimp and oyster samples, respectively. They were amplified with X-BP2-DPO at different concentrations (0, 0.4, and 0.6 μM). A–C are Venn diagrams; the number in the circle represents the number of genera detected in shrimp and/or oyster samples. D is a heatmap of the overall composition of the eukaryotic microorganisms amplified with X-BP2-DPO at 0.6 μM [select log2(X + 1) for data visualization, from blue to red, the number is gradually increasing.].

