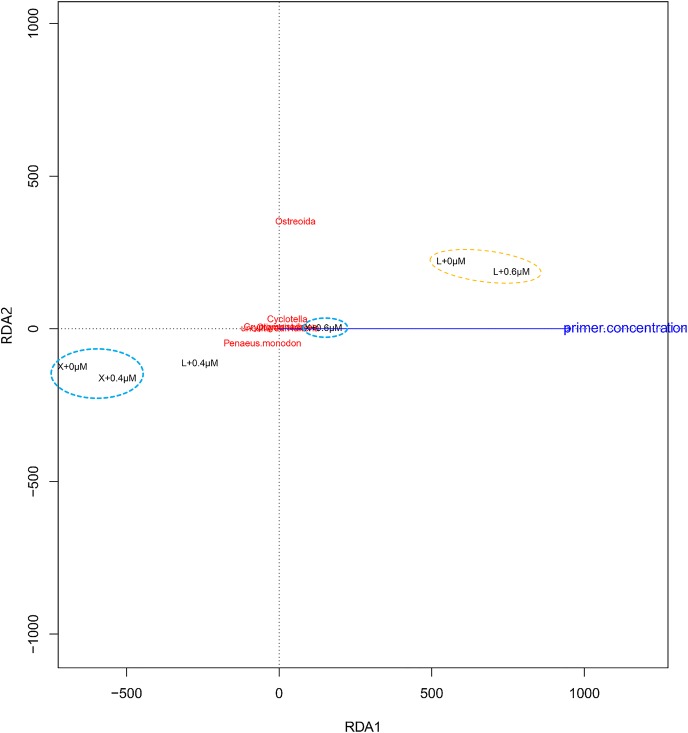
FIGURE 6.
Redundancy analysis (RDA) of the samples and the blocking primer. “+0,” “+0.4,” and “+0.6 μM” imply that the samples were amplified with the blocking primer, X-BP2-DPO at the concentrations of 0, 0.4, and 0.6 μM in the PCRs. “X” and “L” represent the shrimp and oyster samples, respectively.

