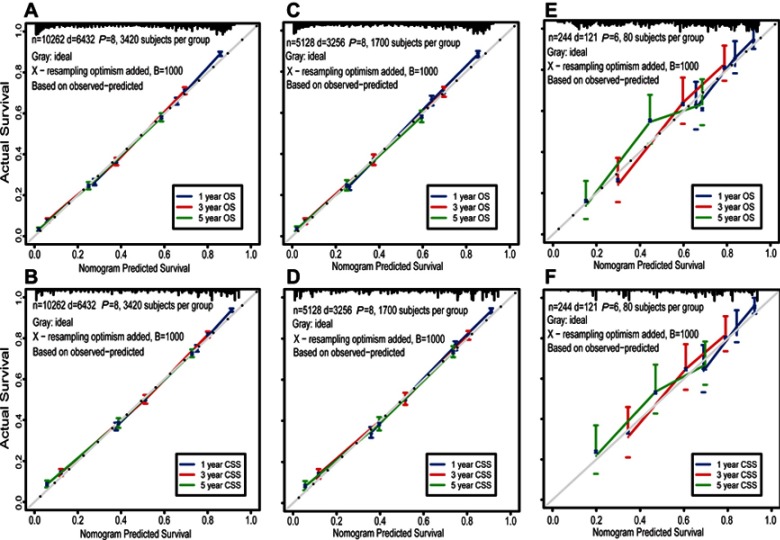
Figure 4.
Calibration curves for predicting 1-, 3- and 5-year OS and CSS in patients with HCC. OS (A) and CSS (B) in the SEER discovery set; OS (C) and CSS (D) in the internal testing set; and OS (E) and CSS (F) in the external validation cohort. The nomogram-predicted probability of survival is plotted on the X-axis, and the actual survival rate is plotted on the Y-axis. Vertical bars indicate 95% CIs measured by Kaplan-Meier analysis.

