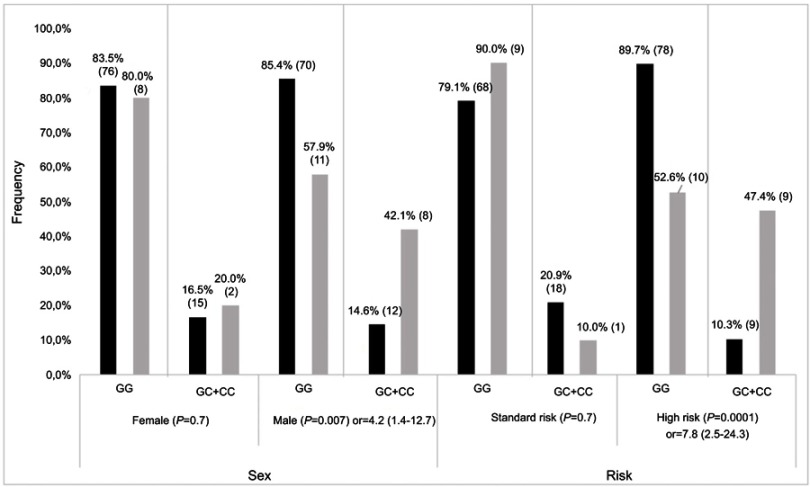
Figure 2.
Stratification result of association for ADAMTS rs4127041. Frequencies of GG and GC+CC genotypes for affected (grey bars) and unaffected (black bars) individuals, as defined by Fmax Z≤−2 SD and Z>−2SD, respectively. P-value with OR (odds radio) and 95% CI (confidence interval) is presented for each comparison. Number of patients in each genotype group is indicated on each bar.

