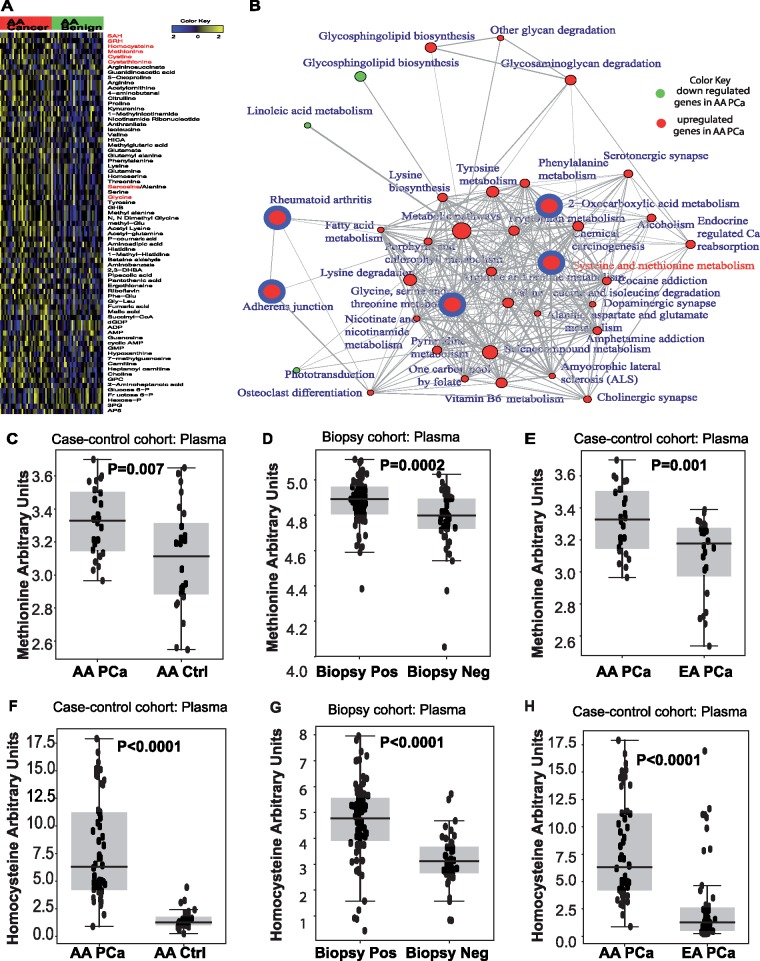
Figure 1.
Methionine-homocysteine levels in African American (AA) prostate cancer (PCa). (A) Heat map showing altered metabolites in localized PCa (n = 33) and matched adjacent benign tissue in ancestry-verified AA patients. Shades of yellow and blue represent an increase or decrease of a metabolite relative to median metabolite levels (false discovery rate [FDR] = 0.3), respectively (refer to color key). Metabolites marked in red belong to the methionine-homocysteine pathway. (B) Network-based Gene Set Analysis map showing differential metabolic pathways between AA PCa and adjacent benign tissue. Pathways enriched at FDR-corrected P value less than .001 are shown in solid circles. The circumference of the circle is correlated to the pathway connectivity. Red and green circles indicate enriched pathways that are up- and downregulated in AA PCa, respectively. Red circles with blue borders indicate the most enriched pathways (P < 10−5). Association between enriched pathways are delineated by the bridges. Components of the methionine-homocysteine pathway are indicated in red font. Boxplots comparing the plasma methionine levels between (C) AA PCa and control subjects (n = 24 each), (D) AA biopsy-positive (n = 78) samples and biopsy-negative control subjects (n = 43), and (E) AA and EA PCa (n = 24 each). Boxplots comparing the plasma homocysteine levels between (F) AA PCa (n = 52) and control subjects (n = 25), (G) AA biopsy positive (n = 80) and biopsy negative (n = 43), and (H) AA PCa (n = 52) and EA PCa (n = 51). Two-sided P values for all the comparisons were calculated using Wilcoxon rank sum test.

