. 2019 Mar 3;16(2):99–119. doi: 10.21873/cgp.20116

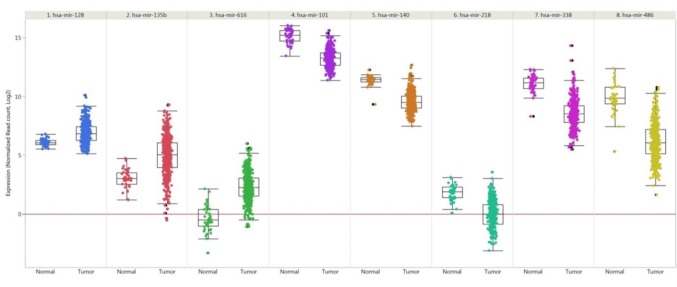
Figure 2. Expression of selected microRNAs in lung squamous carcinoma compared to matching normal tissues. Up-regulated miRs: -128, -135b, - 616. Down-regulated miRs: -101, -140, -218, -338 and -486. Data from 478 lung cancer samples and 45 matching normal samples derived from the LUSC cohort of The Cancer Genome Atlas (TCGA) are shown. miRNA expression was quantified by RNA sequencing and is shown as log2 of normalized read counts. The red lines indicate low versus higher expression. Expression data are shown as box plots. The line in the middle of the box represents the median values, the rectangles show the upper and lower 25% quartiles and 50% of all data points are included in the greater rectangle. All other data points, except for outliers are located within the upper and lower whiskers.

Figure 2