
Figure 2.
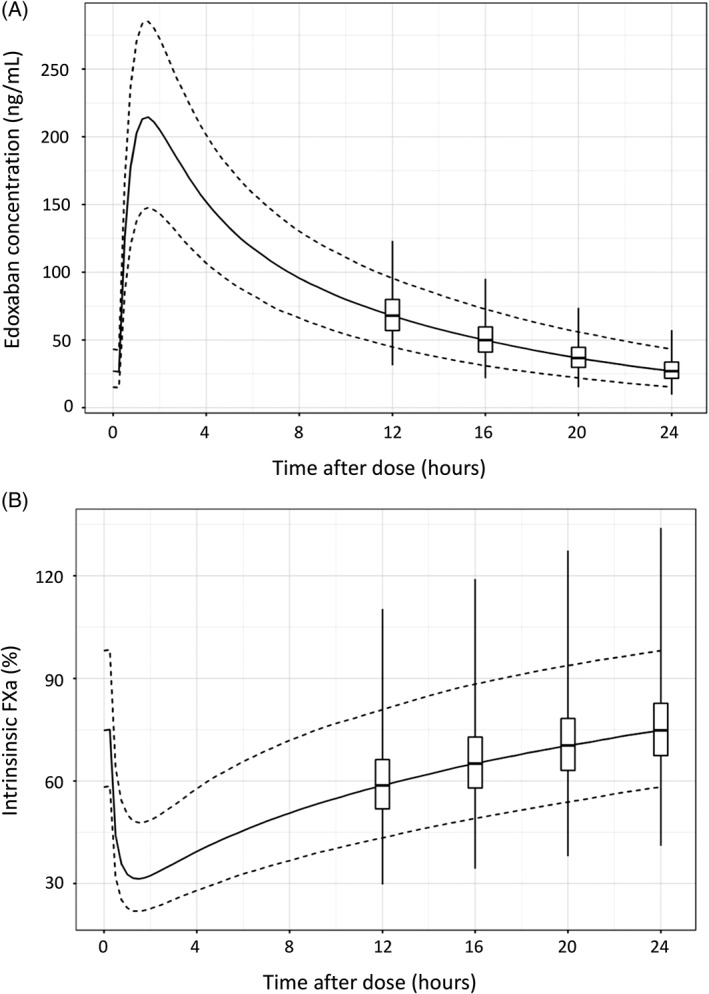
Model predicted (A) steady‐state edoxaban plasma concentration or (B) intrinsic FXa activity over a 24‐hour dosing interval. Prediction was based on PK/PD modeling of edoxaban concentration and intrinsic FXa data collected from 3029 patients in ENGAGE AF‐TIMI 48 trial. Solid line represents the median, and the dashed lines represent the fifth to 95th percentile range of edoxaban plasma concentration or intrinsic FXa activity. Box‐and‐whisker plots shows the distribution of edoxaban plasma concentration or intrinsic FXa activity at specific time points (ie, 12, 16, 20, and 24 hours post‐dose). Boxes represent the first to third quartiles. Whiskers represent the minimum to maximum value range. Abbreviations: ENGAGE AF‐TIMI 48, Effective Anticoagulation With Factor Xa Next Generation in Atrial Fibrillation–Thrombolysis In Myocardial Infarction study 48; FXa, factor Xa; PK/PD, pharmacokinetic/pharmacodynamic