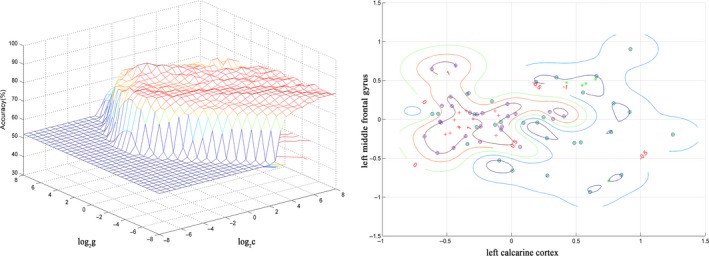
Figure 3.

Visualization of classification by support vector machine (SVM) using the combination of the functional connectivity strength values in the abnormal brain regions. Left: SVM parameters selection result (3D visualization) [Grid Search Method]: Best c = 1.4142; Best g = 22.6274; CV accuracy = 84.507%; Right: the visualization of classification: a combination of the left middle frontal gyrus and left calcarine cortex
