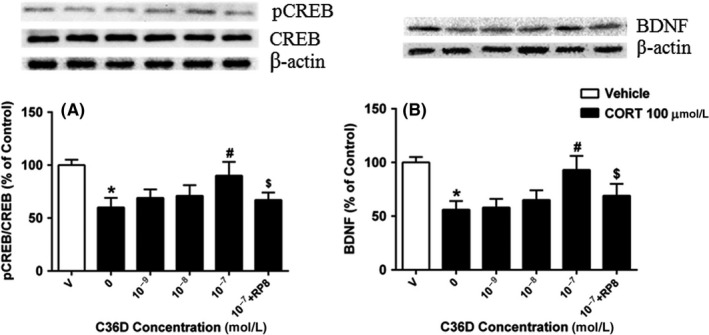
Figure 4.

The effects of C36D on CORT‐induced decreased expression of pCREB A, and BDNF B, in the HT‐22 cells. The results represent the mean ± SEM, n = 6. *P < 0.05, compared to control group. # P < 0.05, compared to vehicle‐treated CORT group. $ P < 0.05, compared to C36D (10−7 mol/L)‐treated CORT group
